ATR-Multiple from 50SMAThis indicator provides a nuanced view of price extension by calculating the distance between the current price and its 50-period Simple Moving Average. This distance is not measured in simple percentage terms but is quantified in multiples of the Average True Range (ATR), offering a volatility-adjusted perspective on how far an asset has moved from its mean.
The primary goal is to help traders identify potentially overextended conditions, which can often precede price consolidation or reversals. As a general guideline, when an asset's price stretches to multiples of 7 ATRs or more above its 50-day SMA, it often enters a zone where significant profit-taking may occur. By visualizing this extension, the indicator can serve as a powerful tool for gauging when to consider taking profits on existing long positions. Furthermore, it can act as a cautionary signal, helping traders avoid initiating new long positions in assets that are already significantly stretched and may be poised for a pullback.
Features
Volatility-Adjusted Extension
Measures the distance from the 50 SMA in terms of ATR multiples, providing a more standardized way to compare extension across different assets and time periods.
Daily Timeframe Consistency
By default, the indicator uses the daily SMA and ATR for its calculations, regardless of the chart's current timeframe. This ensures a consistent and meaningful measure of extension rooted in the daily trend.
Histogram Visualization
Displays the result as a clear histogram in a separate pane, making it easy to track the extension level over time and identify historical extremes.
Dynamic Color-Coding
The histogram bars are color-coded to visually highlight different levels of extension. The colors shift as the price moves further from the mean, providing an intuitive at-a-glance reading.
Key Threshold Markers
Includes pre-set horizontal lines at the 7 and 10 ATR multiples to clearly mark the zones of potential profit-taking and extreme extension, respectively.
Built-in Alerts
Comes with configurable alert conditions that can notify you when the price reaches the "profit-taking" threshold (7 ATRs) or the "extreme extension" threshold (10 ATRs).
Customization Options
MA & ATR Periods
You can adjust the length for the Simple Moving Average (default 50) and the Average True Range (default 14) to suit your specific analytical needs.
Timeframe Source
A toggle allows you to switch between always calculating using daily data (the default and recommended setting) or using the data from the current chart's timeframe.
Color Display Style
You can choose between a smooth color gradient that transitions elegantly with the extension level or a distinct, step-based color display for a clearer visual separation of the defined zones.
Full Color Scheme Control
Every visual element is fully customizable. You can change the colors for the regular extension, the "get ready," "profit-taking," and "extreme" levels, as well as the horizontal reference lines.
In den Scripts nach "take profit" suchen

Fibonacci Entry Bands [AlgoAlpha]OVERVIEW
This script plots Fibonacci Entry Bands, a trend-following and mean-reversion hybrid system built around dynamic volatility-adjusted bands scaled using key Fibonacci levels. It calculates a smoothed basis line and overlays multiple bands at fixed Fibonacci multipliers of either ATR or standard deviation. Depending on the trend direction, specific upper or lower bands become active, offering a clear framework for entry timing, trend identification, and profit-taking zones.
CONCEPTS
The core idea is to use Fibonacci levels—0.618, 1.0, 1.618, and 2.618—as multipliers on a volatility measure to form layered price bands around a trend-following moving average. Trends are defined by whether the basis is rising or falling. The trend determines which side of the bands is emphasized: upper bands for downtrends, lower bands for uptrends. This approach captures both directional bias and extreme price extensions. Take-profit logic is built in via crossovers relative to the outermost bands, scaled by user-selected aggressiveness.
FEATURES
Basis Line – A double EMA smoothing of the source defines trend direction and acts as the central mean.
Volatility Bands – Four levels per side (based on selected ATR or stdev) mark the Fibonacci bands. These become visible only when trend direction matches the side (e.g., only lower bands plot in an uptrend).
Bar Coloring – Bars are shaded with adjustable transparency depending on distance from the basis, with color intensity helping gauge overextension.
Entry Arrows – A trend shift triggers either a long or short signal, with a marker at the outermost band with ▲/▼ signs.
Take-Profit Crosses – If price rejects near the outer band (based on aggressiveness setting), a cross appears marking potential profit-taking.
Bounce Signals – Minor pullbacks that respect the basis line are marked with triangle arrows, hinting at continuation setups.
Customization – Users can toggle bar coloring, signal markers, and select between ATR/stdev as well as take-profit aggressiveness.
Alerts – All major signals, including entries, take-profits, and bounces, are available as alert conditions.
USAGE
To use this tool, load it on your chart, adjust the inputs for volatility method and aggressiveness, and wait for entries to form on trend changes. Use TP crosses and bounce arrows as potential exit or scale-in signals.

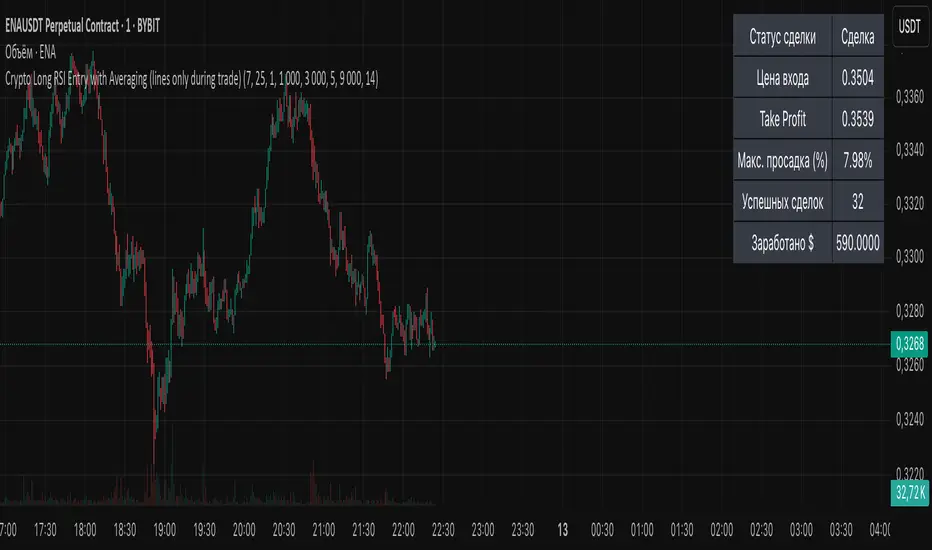
Crypto Long RSI Entry with AveragingIndicator Name:
04 - Crypto Long RSI Entry with Averaging + Info Table + Lines (03 style lines)
Description:
This indicator is designed for crypto trading on the long side only, using RSI-based entry signals combined with a multi-step averaging strategy and a visual information panel. It aims to capture price rebounds from oversold RSI levels and manage position entries with two staged averaging points, optimizing the average entry price and take-profit targets.
Key Features:
RSI-Based Entry: Enters a long position when the RSI crosses above a defined oversold level (default 25), with an optional faster entry if RSI crosses above 20 after being below it.
Two-Stage Averaging: Allows up to two averaging entries at user-defined price drop percentages (default 5% and 14%), increasing position size to improve average entry price.
Dynamic Take Profit: Adjusts take profit targets after each averaging stage, with customizable percentage levels.
Visual Signals: Marks entries, averaging points, and exits on the chart using colored labels and lines for easy tracking.
Info Table: Displays current trade status, averaging stages, total profit, number of wins, and maximum drawdown percentage in a table on the chart.
Graphical Lines: Shows horizontal lines for entry price, take profit, and averaging prices to visually track trade management.
CAFX Liquidity Pro V1CAFX Liquidity Pro Indicator
Precision Engineered for Smart Profit-Taking
The CAFX Liquidity Pro Indicator is a powerful trading tool designed to help traders pinpoint high-probability liquidity zones, making it ideal for setting accurate and strategic take profit levels. By identifying where institutional interest is likely to reside, this indicator highlights the areas where price is most likely to react, reverse, or pause—giving you the edge in locking in profits before the market shifts.
Whether you're scalping, day trading, or swing trading, the CAFX Liquidity Pro provides clear visual cues that simplify your decision-making process and enhance your trade management. With a focus on precision and reliability, it helps you avoid emotional exits and instead base your take profits on real market behavior and liquidity dynamics.
Use CAFX Liquidity Pro to stay one step ahead—because knowing where to exit is just as important as knowing when to enter.

Peters Fibs IndicatorPeters Fibs Indicator helps you find great spots to enter trades, set stop-losses, and take profits using Fibonacci levels. It spots important price swings (highs and lows) and draws key levels on your chart to guide your trading decisions. Here's how it works in simple terms:
1-Finds Swings: It looks at recent price action to spot major highs ("H") and lows ("L") on your chart.
2-Draws Fibonacci Levels: Uses these swings to mark three key levels:
Entry (default at 61.8%): Where you might jump into a trade.
Stop-Loss (default at 79%): Where to cut losses if the trade goes wrong.
Take-Profit (default at 14.6% and -0.236) : Where to lock in profits.
3-Shows Trade Signals: Alerts you when the price hits the entry level, so you know it's time to act.
How to Tweak It for Different Timeframes
You can adjust the indicator to work for fast-paced or slower trading styles by changing a few settings:
*Fast Charts (e.g., 5-minute or 15-minute):
Swing Length: Set to 5-10 to catch quick price swings.
Minimum Bars Between Swings: Use 5-10 to allow swings close together.
*Slower Charts (e.g., 1-hour or 4-hour):
Swing Length: Bump up to 20-50 to focus on bigger, more important swings.
Minimum Bars Between Swings: Set to 15-30 to space out swings for clearer signals.
Ind JDV 2.2 PRO🛡️ Ind JDV 2.0 PRO – Chandelier Exit + FVG + EMA (Precise Entry)
Description:
Ind JDV 2.0 PRO is an advanced indicator that combines three powerful confirmations to find the best trading opportunities:
Chandelier Exit: Filters trade direction based on volatility breakouts controlled by ATR.
Fair Value Gap (FVG): Detects price inefficiency zones at their very first appearance.
EMA (Exponential Moving Average): Acts as a trend filter to ensure trading with the dominant market flow.
🔍 Key Features:
Marks only one precise signal on the candle where the FVG starts.
Confirms the trend using a 150-period EMA (fully adjustable).
Optionally draws Take Profit and Stop Loss target lines for clear visual guidance.
Background color changes (green or red) to reflect the active market trend.
Built-in automatic alerts for buy or sell opportunities.
Optimized code for maximum speed across all timeframes.
✅ Perfect for trading indices, forex, cryptocurrencies, and stocks.
✅ Compatible with all timeframes (5m, 15m, 1H, 4H, Daily).
✅ Fully customizable to fit scalping, intraday, or swing trading styles.
⚙️ Default Parameters:
ATR Period: 10
ATR Multiplier: 3.0
EMA Period: 150
FVG Lookback: 3 candles
Take Profit: 100 points
Stop Loss: 50 points
(All values are adjustable in settings.)
📈 How it works:
The indicator analyzes price structure.
Detects a valid Fair Value Gap (FVG) formation.
Confirms the breakout with a Chandelier Exit signal.
Verifies price alignment with the EMA trend.
Triggers a single entry signal (BUY or SELL) exactly on the first candle that meets all conditions.
🚀 Optimize your trading by focusing on high-probability zones, supported by solid confirmations and clean visual signals.
Add Ind JDV 2.0 PRO to your trading arsenal and take your strategy to the next level! 🔥

TCP | Money Management indicator | Crypto Version📌 TCP | Money Management Indicator | Crypto Version
A robust, multi-target risk and capital management indicator tailored for crypto traders. Whether you're trading spot, perpetual futures, or leverage tokens, this tool empowers you with precise control over risk, reward, and position sizing—directly on your chart. Eliminate guesswork and trade with confidence.
🔰 Introduction: Master Your Capital, Master Your Trades
Poor money management is the number one reason traders lose their accounts, even with solid strategies. The TCP Money Management Indicator, built by Trade City Pro (TCP), solves this problem by providing a structured, rule-based approach to capital allocation.
Want to dive deeper into the concept of money management? Check out our comprehensive tutorial on TradingView, " TradeCityPro Academy: Money Management ", to understand the principles that power this indicator and transform your trading mindset.
This indicator equips you to:
• Calculate optimal position sizes based on your capital, risk percentage, and leverage
• Set up to 5 customizable take-profit targets with partial close percentages
• Access real-time metrics like Risk-to-Reward (R/R), USD profit, and margin usage
• Trade with discipline, avoiding emotional or inconsistent decisions
💸 Money Management Formula
The indicator uses a professional capital allocation model:
Position Size = (Capital × Risk %) ÷ (Stop Loss % × Leverage)
From this, it calculates:
• Total risk amount in USD
• Optimal position size for your trade
• Margin required for each take-profit target
• Adjusted R/R for each target, accounting for partial position closures
🛠 How to Use
Enter Trade Parameters: Input your capital, risk %, leverage, entry price, and stop-loss price.
Set Take-Profit Targets: Enable 1 to 5 take-profit levels and specify the percentage of the position to close at each.
Real-Time Calculations: The indicator automatically computes:
• R/R ratio for each target
• Profit in USD for each partial close
• Margin used per target (in % and USD)
Visualize Your Trade:
• Price levels for entry, stop-loss, and take-profits are plotted on the chart.
• A dynamic info panel on the left side displays all key metrics.
🔄 Dynamic Adjustments: As each take-profit target is hit and a portion of the position is closed, the indicator recalculates the remaining position size, expected profit, R/R, and margin for subsequent targets. This ensures accuracy and reflects real-world trade behavior.
📊 Table Overview
The left-side panel provides a clear snapshot:
• Trade Setup: Capital, entry price, stop-loss, risk amount, and position size
• Per Target: Percentage closed, R/R, profit in USD, and margin used
• Summary: Total expected profit across all targets
⚙️ Settings Panel
• Total Capital ($): Your account size for the trade
• Risk per Trade (%): The percentage of capital you’re willing to risk
• Leverage: The leverage applied to the trade
• Entry/Stop-Loss Prices: Define your trade’s risk zone
• Take-Profit Targets (1–5): Set price levels and percentage to close at each
🔍 Use Case Example
Imagine you have $1,000 capital, risking 1%, using 10x leverage:
• Entry: $100 | Stop-Loss: $95
• TP1: $110 (close 50%) | TP2: $115 (close 50%)
The indicator calculates the exact position size, profit at each target, and margin allocation in real time, with all metrics displayed on the chart.
✅ Why Traders Love It
• Precision: No more manual calculations or guesswork
• Versatility: Works on all crypto pairs (BTC, ETH, altcoins, etc.)
• Flexibility: Perfect for scalping, swing trading, or futures strategies
• Universal: Compatible with all timeframes
• Transparency: Fully manual, with clear and reliable outputs
🧩 Built by Trade City Pro (TCP)
Developed by TCP, a trusted name in trading tools, used by over 150,000 traders worldwide. This indicator is coded in Pine Script v5, ensuring compatibility with TradingView’s platform.
🧾 Final Notes
• No Auto-Trading: This is a manual tool for disciplined traders
• No Repainting: All calculations are accurate and non-repainting
• Tested: Rigorously validated across major crypto pairs
• Publish-Ready: Built for seamless use on TradingView
🔗 Resources
• Money Management Tutorial: Learn the fundamentals of capital management with our detailed guide: TradeCityPro Academy: Money Management
• TradingView Profile: Explore more tools by TCP on TradingView

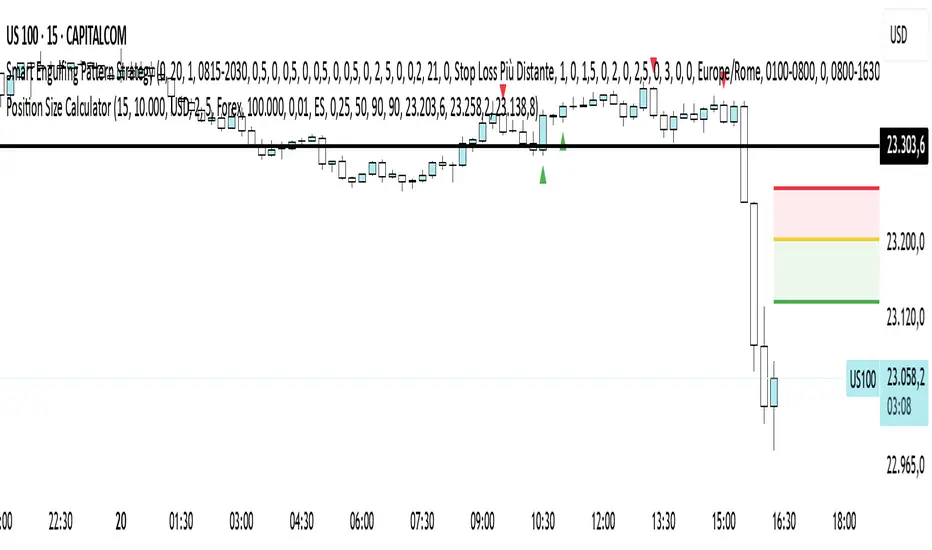
Position Size CalculatorPosition Size Calculator - User Guide
A simple tool to calculate optimal position size based on your risk preferences, visualize trade levels, and automatically determine trade direction.
Introduction
The Position Size Calculator is a TradingView indicator designed to help traders calculate the optimal position size for their trades based on account size and risk tolerance. This tool visually represents entry, stop loss, and take profit levels while automatically calculating the appropriate position size to maintain consistent risk management.
Getting Started
Setting Up Your Account Parameters
Setting Price Levels
Understanding the Visual Elements
Adjusting Your Trade on the Chart
Reading the Information Panel
1. Getting Started
After adding the indicator to your chart, you'll see three horizontal lines representing:
Yellow line: Entry price
Green line: Take profit price
Red line: Stop loss price
The indicator automatically detects whether you're planning a Long or Short trade based on the position of your take profit relative to your entry.
2. Setting Up Your Account Parameters
In the "Position Calculator" settings group:
Account Size : Enter your total account balance
Account Currency : Set your account currency (USD, EUR, etc.)
Risk (%) : Enter the percentage of your account you're willing to risk per trade (e.g., 2%)
Instrument Type : Select your trading instrument (Forex, Futures, Stocks, or Crypto)
Value per 0.01 lot per tick : Enter the value of 0.01 lots per tick (for most Forex pairs, this is $1 per pip for 0.01 lot)
Minimum Lot Size : Set the minimum lot size allowed by your broker (usually 0.01 for Forex)
3. Setting Price Levels
In the "Price Levels" section:
Entry Price : The price at which you plan to enter the trade
Stop Loss Price : Where you'll exit if the trade goes against you
Take Profit Price : Your target price where you'll take profits
If you set Entry Price to 0, it will default to the current price. If Stop Loss or Take Profit are set to 0, they'll default to 5% below or above entry price respectively.
4. Understanding the Visual Elements
Yellow line : Your entry price
Green line : Your take profit level
Red line : Your stop loss level
Green zone : The profit zone (between entry and take profit)
Red zone : The loss zone (between entry and stop loss)
Information panel : Shows all calculations and trade details
5. Adjusting Your Trade on the Chart
The beauty of this tool is its interactivity:
You can drag any of the lines directly on the chart to adjust entry, stop loss, or take profit
If you drag the take profit above the entry , the indicator automatically sets up for a Long trade
If you drag the take profit below the entry , it automatically configures for a Short trade
All calculations and visuals update in real-time as you adjust the lines
This means you can quickly test different scenarios and see how they affect your position size and potential profit/loss.
6. Reading the Information Panel
The information panel displays:
Account details : Your account size and currency
Risk information : Your percentage risk and the equivalent monetary amount
Position Size : The optimal lot size calculated based on your risk parameters
Price levels : Entry, Stop Loss, and Take Profit with distances in ticks
Risk/Reward ratio : Shown as 1:X (where X is the reward relative to 1 unit of risk)
Potential outcomes : The exact amount you stand to gain or lose on this trade
Trade direction : Whether this is a Long or Short trade
Visual Settings
You can customize the appearance in the "Visual" settings group:
Adjust colors for profit and loss zones
Change the transparency of colored zones
Toggle the filling of spaces between lines
Adjust how far the lines extend beyond the last candle
Practical Tips
Always double-check your "Value per 0.01 lot per tick" setting for the specific instrument you're trading
For Forex major pairs, the standard is usually $1 per pip for 0.01 lots
For other instruments, consult your broker's specifications
The indicator works best when you place your stop loss at a logical market level (support/resistance, swing high/low) rather than a fixed percentage
Final Thoughts
This Position Size Calculator helps remove emotion from your trading by objectively calculating your position size based on your predefined risk parameters. It ensures that you maintain consistent risk across all your trades, regardless of the stop loss distance, which is a key component of successful risk management.
Remember: The most important goal in trading is capital preservation. This tool helps you ensure that each trade risks only what you've decided is acceptable for your trading strategy.
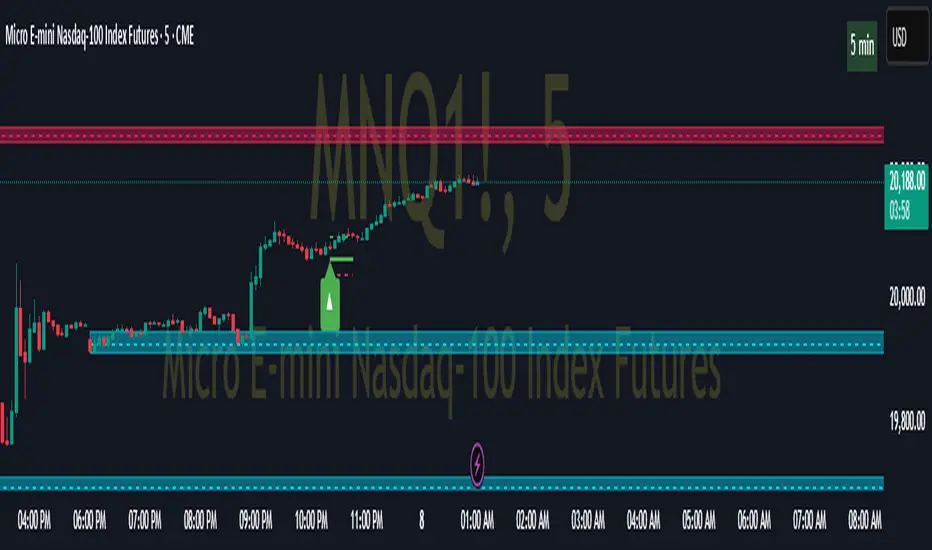
Pivot ATR Zones [v6]🟩 Pivot ATR Zones
Overview:
The Pivot ATR Zones indicator plots dynamic support and resistance zones based on pivot highs and lows, combined with ATR (Average True Range) volatility levels. It helps traders visually identify potential long and short trade areas, along with realistic target and stop loss zones based on market conditions.
Features:
Automatically detects pivot highs and lows
Draws ATR-based entry zones on the chart
Plots dynamic take-profit and stop-loss levels using ATR multipliers
Color-coded long (green) and short (red) zones
Entry arrow markers for clearer trade visualization
Real-time alerts when new zones form
Best For:
Scalpers, intraday traders, and swing traders who want a visual, volatility-aware way to mark potential trade areas based on key pivot structures.
How to Use:
Look for newly formed green zones for long opportunities and red zones for short setups.
Use the dashed lines as dynamic take-profit and stop levels, tuned to the current ATR value.
Combine with other confirmation tools or indicators for optimal results.
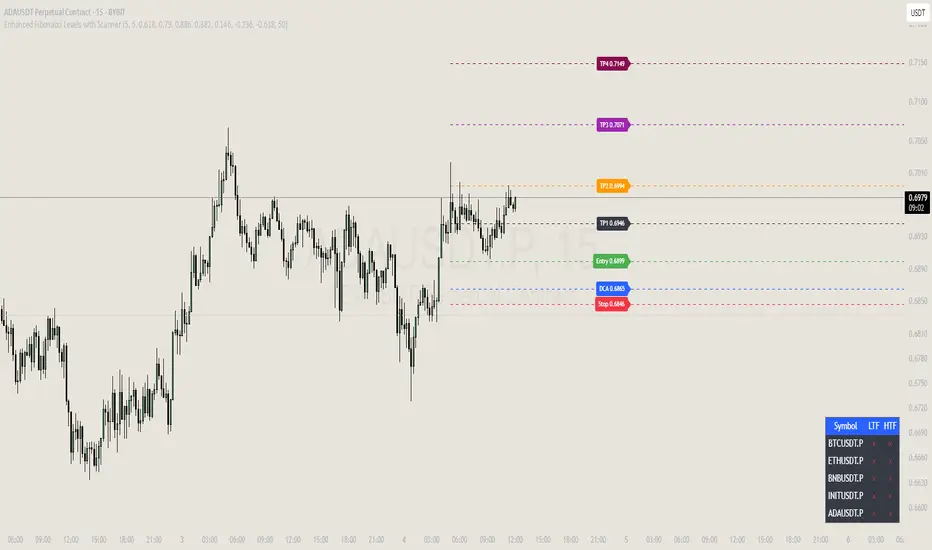
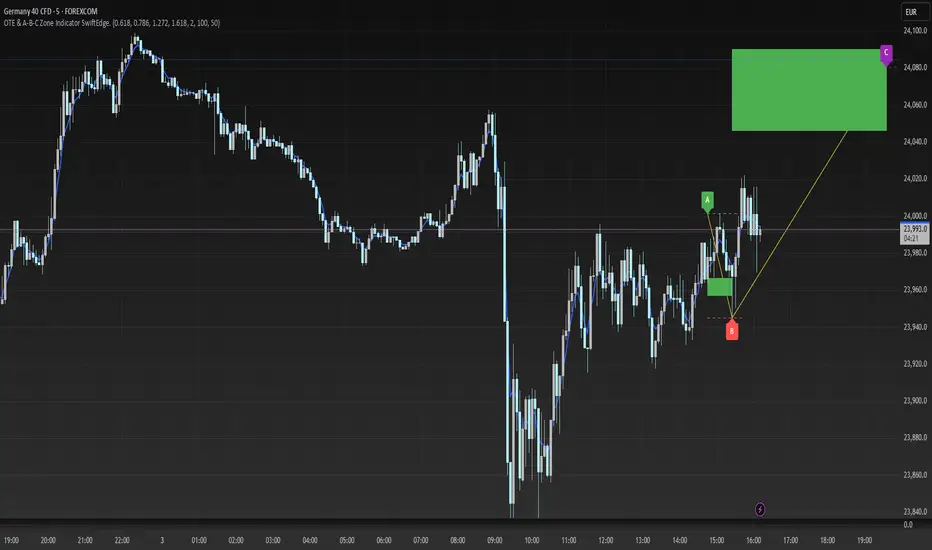
OTE & A-B-C Zone Indicator SwiftEdgeOTE & A-B-C Zone Indicator SwiftEdge
Overview
The OTE & A-B-C Zone Indicator SwiftEdge is a versatile tool designed to help traders identify high-probability trading setups using a combination of Optimal Trade Entry (OTE) zones, Fibonacci levels, and A-B-C price patterns. This indicator is particularly useful for traders who rely on price action and Fibonacci-based strategies to find entry points, set stop-losses, and target potential take-profit levels. By integrating swing point detection, trend analysis, and Fibonacci projections, SwiftEdge provides a clear visual framework for making informed trading decisions across various timeframes.
What It Does
SwiftEdge identifies key price levels and zones to guide your trading:
OTE Zone: Highlights the Optimal Trade Entry zone between swing points A (swing high) and B (swing low) using Fibonacci retracement levels (default: 0.618 to 0.786). This zone represents a high-probability area for price reversals, making it an ideal entry point for trades.
A-B-C Pattern: Marks the latest swing points as A (swing high), B (swing low), and C (projected take-profit level) with dashed lines and labels. A solid line connects A to B to C, visually illustrating the price movement from entry to target.
Take-Profit Zones: Projects three customizable take-profit levels (TP1, TP2, TP3) based on Fibonacci extensions (default: 1.272, 1.618, 2.0) from the A-B swing, helping traders plan exits with favorable risk-reward ratios.
How It Works
SwiftEdge combines several technical components to create a cohesive trading system:
Swing Point Detection: Identifies significant swing highs (A) and swing lows (B) using a dynamic lookback period that adjusts to the selected timeframe. On lower timeframes like 1-minute charts, an ATR-based filter reduces noise by requiring price movements to exceed a threshold (0.5 * ATR(14)).
Trend Analysis: Uses an Exponential Moving Average (EMA) to determine the trend direction (default: 50-period EMA on 1H). The indicator marks uptrends (price above EMA) in green and downtrends (price below EMA) in red, ensuring trades align with the market's direction.
Fibonacci Levels: Applies Fibonacci retracement to define the OTE zone between A and B, and Fibonacci extensions to project take-profit levels (C) beyond the initial swing. This approach leverages the natural tendency of markets to respect Fibonacci ratios for reversals and extensions.
Visual Clarity: Displays only the latest A-B-C pattern with three dashed lines (A, B, C) and a solid connecting line, ensuring the chart remains uncluttered and easy to interpret.
The combination of these elements creates a structured setup where the OTE zone (between A and B) serves as an entry point, while the projected C level offers a target, all within the context of the prevailing trend. This synergy makes SwiftEdge a powerful tool for traders seeking to combine price action, trend analysis, and Fibonacci strategies.
How to Use
Add the Indicator: Apply the indicator to your chart via TradingView's indicator menu.
Identify the Trend: The OTE zone and A-B-C pattern will be colored green in uptrends (price above EMA) or red in downtrends (price below EMA). Use this to determine the market direction.
Entry Point: Look for price reversals within the OTE zone (between A and B). This zone is typically between the 0.618 and 0.786 Fibonacci retracement levels of the A-B swing, making it a high-probability area for entries.
Stop-Loss: Place your stop-loss below the OTE zone in an uptrend (or above in a downtrend) to protect against false breakouts.
Take-Profit Targets: Use the projected take-profit zones (TP1, TP2, TP3) as potential exit levels. These are based on Fibonacci extensions and can be toggled on/off in the settings.
Customization:
Adjust the Fibonacci levels for the OTE zone (Fibonacci Level 1 and Fibonacci Level 2) to suit your strategy.
Modify the take-profit levels (Fibonacci Extension Level for TP1/TP2/TP3) to target different extension ratios.
Change the lookback period (Base Lookback Period) and EMA period (Base EMA Period) to fine-tune swing point detection and trend sensitivity.
Customize colors for uptrends, downtrends, and A-B-C lines to match your preferences.
What Makes It Unique
SwiftEdge stands out by integrating swing point detection, Fibonacci-based OTE zones, and A-B-C price patterns into a single, visually intuitive indicator. Unlike standalone Fibonacci tools or trend indicators, SwiftEdge combines these elements to provide a complete trading setup: it identifies entry zones (OTE), confirms trend direction (EMA), and projects take-profit targets (Fibonacci extensions). The dynamic timeframe adjustment ensures consistent performance across all chart intervals, while the clean A-B-C visualization (with only the latest pattern displayed) prevents chart clutter, making it easier to focus on the most relevant price levels.
Notes
This indicator is designed for traders familiar with price action and Fibonacci strategies. It does not guarantee profits and should be used in conjunction with other analysis tools and proper risk management.
Performance may vary depending on market conditions and timeframe. Test the indicator on a demo account before using it in live trading.
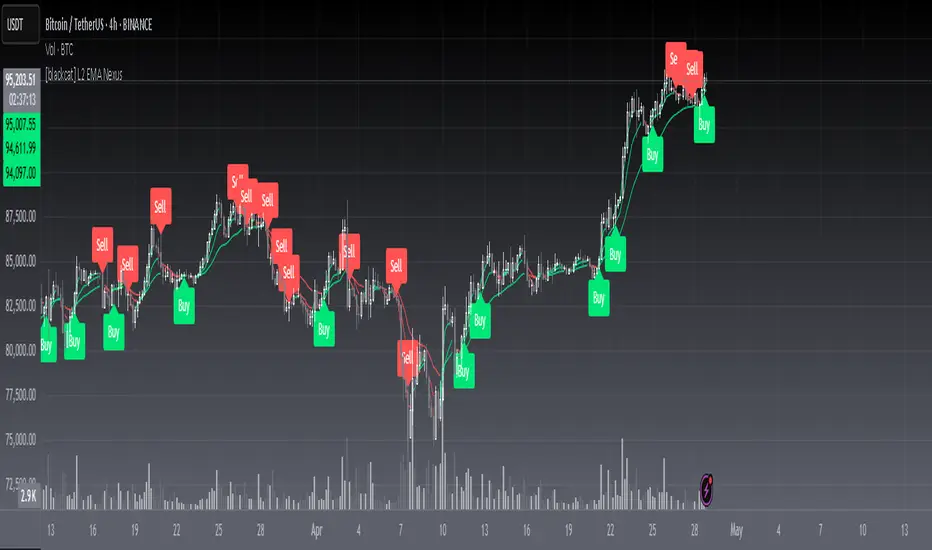
[blackcat] L2 EMA NexusOVERVIEW
The L2 EMA Nexus is a comprehensive trading indicator that utilizes a three-tiered Exponential Moving Average (EMA) system to identify potential trading opportunities. This script combines technical analysis with robust risk management features to help traders make informed decisions.
KEY FEATURES
• Triple EMA Analysis:
Customizable source inputs for each EMA
Adjustable length parameters (3, 8, 21 periods)
Dynamic color coding based on trend direction
Real-time price action monitoring
• Advanced Entry Signals:
High-low price action verification
EMA cross-overs and cross-unders
Multi-timeframe trend confirmation
Dynamic position sizing limits
• Risk Management:
Configurable Take Profit levels
Flexible Stop Loss settings
Optional TP/SL activation
Clear visual indicators for levels
HOW TO USE
Setup Initial Parameters:
Configure EMA lengths for your timeframe
Set Take Profit percentage (default 25%)
Define Stop Loss percentage (default 2.5%)
Adjust pyramiding limit as needed
Enable/Disable Features:
Toggle TP/SL settings based on strategy
Customize alert conditions
Modify visual labels for clarity
Monitor Trading Signals:
Watch for buy/sell labels
Track TP/SL levels
Monitor position status
TRADE MANAGEMENT
• Entry Conditions:
Long Entry: Higher high with rising EMA1 and stable EMA3
Short Entry: Lower low with falling EMA1 and stable EMA2
• Exit Conditions:
Take Profit: Price reaches defined percentage above/below entry
Stop Loss: Price reaches defined percentage below/above entry
• Position Control:
Limited to specified number of positions
Automatic position tracking
Clear visual indication of current trades
TECHNICAL DETAILS
• EMA Calculation:
Uses Exponential Moving Average for trend following
Color-coded based on 2-bar trend direction
Multiple timeframe compatibility
• Label System:
Clear buy/sell markers
Take Profit and Stop Loss indicators
Real-time position status updates
• Alert Configuration:
Customizable alert messages
Multiple alert conditions
Option to enable/disable specific alerts
LIMITATIONS
⚠️ Important Considerations:
Results may vary across different market conditions
Historical performance does not guarantee future results
Always backtest strategy before live trading
Consider complementing with additional analysis tools
BEST PRACTICES
• Recommended Timeframes:
Daily charts for long-term strategies
4-hour charts for swing trading
1-hour charts for short-term trading
• Risk Management Tips:
Start with small position sizes
Always use TP/SL in live trading
Monitor market volatility before entering trades
TROUBLESHOOTING
• Common Issues:
Ensure proper chart resolution
Verify alert conditions are enabled
Check for conflicting indicators
• Performance Optimization:
Use appropriate timeframe for your strategy
Adjust indicator parameters based on market conditions
Monitor for potential overfitting
[blackcat] L3 Hull SeekerOVERVIEW
The L3 Hull Seeker is a comprehensive trading indicator that combines Hull Moving Average (HMA) analysis with robust position management and risk control features. This script is designed to help traders identify potential entry and exit points while maintaining strict risk management protocols.
KEY FEATURES
• Hull MA Analysis:
Advanced Hull Moving Average calculations
Separate Hull MA lines for Close and Open prices
Visual color coding for trend direction
Customizable length parameter for flexibility
• Position Tracking:
Real-time monitoring of long and short positions
Maximum position limit control
Clear position status indicators on chart
• Risk Management System:
User-defined Take Profit percentage
User-defined Stop Loss percentage
Optional activation of TP/SL features
Dynamic label markers for important levels
• Alert System:
Buy/Sell entry alerts
Take Profit/Stop Loss exit alerts
Position status changes
HOW TO USE
Setup Initial Parameters:
Hull MA Length: Adjust based on your trading timeframe
Take Profit Percentage: Set according to your risk tolerance
Stop Loss Percentage: Define your maximum acceptable loss
Enable/Disable Features:
Toggle Take Profit/Stop Loss options as needed
Adjust alert conditions for your trading style
Monitor Trading Signals:
Watch for crossover/crossunder signals
Track position status through labels
Monitor entry and exit alerts
Manage Risk:
Use TP/SL features to control position size
Monitor pyramiding limits
Review position status regularly
TRADE MANAGEMENT
• Entry Conditions:
Long Entry: HullMA_close crosses above HullMA_open
Short Entry: HullMA_close crosses below HullMA_open
• Exit Conditions:
Take Profit: Price reaches defined percentage above/below entry
Stop Loss: Price reaches defined percentage below/above entry
• Position Control:
Limited to one position at a time
Automatic position tracking
Clear visual indication of current trades
TECHNICAL DETAILS
• Hull MA Calculation:
Uses WMA (Weighted Moving Average) for precise calculations
Optimized for trend-following strategies
Smoothed Hull MA lines for better readability
• Label System:
Clear buy/sell markers
Take Profit and Stop Loss indicators
Real-time position status updates
• Alert Configuration:
Customizable alert messages
Multiple alert conditions
Option to enable/disable specific alerts
LIMITATIONS
⚠️ Important Considerations:
Results may vary across different market conditions
Historical performance does not guarantee future results
Always backtest strategy before live trading
Consider complementing with additional analysis tools
BEST PRACTICES
• Recommended Timeframes:
Daily charts for long-term strategies
4-hour charts for swing trading
1-hour charts for short-term trading
• Risk Management Tips:
Start with small position sizes
Always use TP/SL in live trading
Monitor market volatility before entering trades
TROUBLESHOOTING
• Common Issues:
Ensure proper chart resolution
Verify alert conditions are enabled
Check for conflicting indicators
• Performance Optimization:
Use appropriate timeframe for your strategy
Adjust indicator parameters based on market conditions
Monitor for potential overfitting

ADR% Extension Levels from SMA 50I created this indicator inspired by RealSimpleAriel (a swing trader I recommend following on X) who does not buy stocks extended beyond 4 ADR% from the 50 SMA and uses extensions from the 50 SMA at 7-8-9-10-11-12-13 ADR% to take profits with a 20% position trimming.
RealSimpleAriel's strategy (as I understood it):
-> Focuses on leading stocks from leading groups and industries, i.e., those that have grown the most in the last 1-3-6 months (see on Finviz groups and then select sector-industry).
-> Targets stocks with the best technical setup for a breakout, above the 200 SMA in a bear market and above both the 50 SMA and 200 SMA in a bull market, selecting those with growing Earnings and Sales.
-> Buys stocks on breakout with a stop loss set at the day's low of the breakout and ensures they are not extended beyond 4 ADR% from the 50 SMA.
-> 3-5 day momentum burst: After a breakout, takes profits by selling 1/2 or 1/3 of the position after a 3-5 day upward move.
-> 20% trimming on extension from the 50 SMA: At 7 ADR% (ADR% calculated over 20 days) extension from the 50 SMA, takes profits by selling 20% of the remaining position. Continues to trim 20% of the remaining position based on the stock price extension from the 50 SMA, calculated using the 20-period ADR%, thus trimming 20% at 8-9-10-11 ADR% extension from the 50 SMA. Upon reaching 12-13 ADR% extension from the 50 SMA, considers the stock overextended, closes the remaining position, and evaluates a short.
-> Trailing stop with ascending SMA: Uses a chosen SMA (10, 20, or 50) as the definitive stop loss for the position, depending on the stock's movement speed (preferring larger SMAs for slower-moving stocks or for long-term theses). If the stock's closing price falls below the chosen SMA, the entire position is closed.
In summary:
-->Buy a breakout using the day's low of the breakout as the stop loss (this stop loss is the most critical).
--> Do not buy stocks extended beyond 4 ADR% from the 50 SMA.
--> Sell 1/2 or 1/3 of the position after 3-5 days of upward movement.
--> Trim 20% of the position at each 7-8-9-10-11-12-13 ADR% extension from the 50 SMA.
--> Close the entire position if the breakout fails and the day's low of the breakout is reached.
--> Close the entire position if the price, during the rise, falls below a chosen SMA (10, 20, or 50, depending on your preference).
--> Definitively close the position if it reaches 12-13 ADR% extension from the 50 SMA.
I used Grok from X to create this indicator. I am not a programmer, but based on the ADR% I use, it works.
Below is Grok from X's description of the indicator:
Script Description
The script is a custom indicator for TradingView that displays extension levels based on ADR% relative to the 50-period Simple Moving Average (SMA). Below is a detailed description of its features, structure, and behavior:
1. Purpose of the Indicator
Name: "ADR% Extension Levels from SMA 50".
Objective: Draw horizontal blue lines above and below the 50-period SMA, corresponding to specific ADR% multiples (4, 7, 8, 9, 10, 11, 12, 13). These levels represent potential price extension zones based on the average daily percentage volatility.
Overlay: The indicator is overlaid on the price chart (overlay=true), so the lines and SMA appear directly on the price graph.
2. Configurable Inputs
The indicator allows users to customize parameters through TradingView settings:
SMA Length (smaLength):
Default: 50 periods.
Description: Specifies the number of periods for calculating the Simple Moving Average (SMA). The 50-period SMA serves as the reference point for extension levels.
Constraint: Minimum 1 period.
ADR% Length (adrLength):
Default: 20 periods.
Description: Specifies the number of days to calculate the moving average of the daily high/low ratio, used to determine ADR%.
Constraint: Minimum 1 period.
Scale Factor (scaleFactor):
Default: 1.0.
Description: An optional multiplier to adjust the distance of extension levels from the SMA. Useful if levels are too close or too far due to an overly small or large ADR%.
Constraint: Minimum 0.1, increments of 0.1.
Tooltip: "Adjust if levels are too close or far from SMA".
3. Main Calculations
50-period SMA:
Calculated with ta.sma(close, smaLength) using the closing price (close).
Serves as the central line around which extension levels are drawn.
ADR% (Average Daily Range Percentage):
Formula: 100 * (ta.sma(dhigh / dlow, adrLength) - 1).
Details:
dhigh and dlow are the daily high and low prices, obtained via request.security(syminfo.tickerid, "D", high/low) to ensure data is daily-based, regardless of the chart's timeframe.
The dhigh / dlow ratio represents the daily percentage change.
The simple moving average (ta.sma) of this ratio over 20 days (adrLength) is subtracted by 1 and multiplied by 100 to obtain ADR% as a percentage.
The result is multiplied by scaleFactor for manual adjustments.
Extension Levels:
Defined as ADR% multiples: 4, 7, 8, 9, 10, 11, 12, 13.
Stored in an array (levels) for easy iteration.
For each level, prices above and below the SMA are calculated as:
Above: sma50 * (1 + (level * adrPercent / 100))
Below: sma50 * (1 - (level * adrPercent / 100))
These represent price levels corresponding to a percentage change from the SMA equal to level * ADR%.
4. Visualization
Horizontal Blue Lines:
For each level (4, 7, 8, 9, 10, 11, 12, 13 ADR%), two lines are drawn:
One above the SMA (e.g., +4 ADR%).
One below the SMA (e.g., -4 ADR%).
Color: Blue (color.blue).
Style: Solid (style=line.style_solid).
Management:
Each level has dedicated variables for upper and lower lines (e.g., upperLine1, lowerLine1 for 4 ADR%).
Previous lines are deleted with line.delete before drawing new ones to avoid overlaps.
Lines are updated at each bar with line.new(bar_index , level, bar_index, level), covering the range from the previous bar to the current one.
Labels:
Displayed only on the last bar (barstate.islast) to avoid clutter.
For each level, two labels:
Above: E.g., "4 ADR%", positioned above the upper line (style=label.style_label_down).
Below: E.g., "-4 ADR%", positioned below the lower line (style=label.style_label_up).
Color: Blue background, white text.
50-period SMA:
Drawn as a gray line (color.gray) for visual reference.
Diagnostics:
ADR% Plot: ADR% is plotted in the status line (orange, histogram style) to verify the value.
ADR% Label: A label on the last bar near the SMA shows the exact ADR% value (e.g., "ADR%: 2.34%"), with a gray background and white text.
5. Behavior
Dynamic Updating:
Lines update with each new bar to reflect new SMA 50 and ADR% values.
Since ADR% uses daily data ("D"), it remains constant within the same day but changes day-to-day.
Visibility Across All Bars:
Lines are drawn on every bar, not just the last one, ensuring visibility on historical data as well.
Adaptability:
The scaleFactor allows level adjustments if ADR% is too small (e.g., for low-volatility symbols) or too large (e.g., for cryptocurrencies).
Compatibility:
Works on any timeframe since ADR% is calculated from daily data.
Suitable for symbols with varying volatility (e.g., stocks, forex, cryptocurrencies).
6. Intended Use
Technical Analysis: Extension levels represent significant price zones based on average daily volatility. They can be used to:
Identify potential price targets (e.g., take profit at +7 ADR%).
Assess support/resistance zones (e.g., -4 ADR% as support).
Measure price extension relative to the 50 SMA.
Trading: Useful for strategies based on breakouts or mean reversion, where ADR% levels indicate reversal or continuation points.
Debugging: Labels and ADR% plot help verify that values align with the symbol’s volatility.
7. Limitations
Dependence on Daily Data: ADR% is based on daily dhigh/dlow, so it may not reflect intraday volatility on short timeframes (e.g., 1 minute).
Extreme ADR% Values: For low-volatility symbols (e.g., bonds) or high-volatility symbols (e.g., meme stocks), ADR% may require adjustments via scaleFactor.
Graphical Load: Drawing 16 lines (8 upper, 8 lower) on every bar may slow the chart for very long historical periods, though line management is optimized.
ADR% Formula: The formula 100 * (sma(dhigh/dlow, Length) - 1) may produce different values compared to other ADR% definitions (e.g., (high - low) / close * 100), so users should be aware of the context.
8. Visual Example
On a chart of a stock like TSLA (daily timeframe):
The 50 SMA is a gray line tracking the average trend.
Assuming an ADR% of 3%:
At +4 ADR% (12%), a blue line appears at sma50 * 1.12.
At -4 ADR% (-12%), a blue line appears at sma50 * 0.88.
Other lines appear at ±7, ±8, ±9, ±10, ±11, ±12, ±13 ADR%.
On the last bar, labels show "4 ADR%", "-4 ADR%", etc., and a gray label shows "ADR%: 3.00%".
ADR% is visible in the status line as an orange histogram.
9. Code: Technical Structure
Language: Pine Script @version=5.
Inputs: Three configurable parameters (smaLength, adrLength, scaleFactor).
Calculations:
SMA: ta.sma(close, smaLength).
ADR%: 100 * (ta.sma(dhigh / dlow, adrLength) - 1) * scaleFactor.
Levels: sma50 * (1 ± (level * adrPercent / 100)).
Graphics:
Lines: Created with line.new, deleted with line.delete to avoid overlaps.
Labels: Created with label.new only on the last bar.
Plots: plot(sma50) for the SMA, plot(adrPercent) for debugging.
Optimization: Uses dedicated variables for each line (e.g., upperLine1, lowerLine1) for clear management and to respect TradingView’s graphical object limits.
10. Possible Improvements
Option to show lines only on the last bar: Would reduce visual clutter.
Customizable line styles: Allow users to choose color or style (e.g., dashed).
Alert for anomalous ADR%: A message if ADR% is too small or large.
Dynamic levels: Allow users to specify ADR% multiples via input.
Optimization for short timeframes: Adapt ADR% for intraday timeframes.
Conclusion
The script creates a visual indicator that helps traders identify price extension levels based on daily volatility (ADR%) relative to the 50 SMA. It is robust, configurable, and includes debugging tools (ADR% plot and labels) to verify values. The ADR% formula based on dhigh/dlow

Bullish and Bearish Breakout Alert for Gold Futures PullbackBelow is a Pine Script (version 6) for TradingView that includes both bullish and bearish breakout conditions for my intraday trading strategy on micro gold futures (MGC). The strategy focuses on scalping two-legged pullbacks to the 20 EMA or key levels with breakout confirmation, tailored for the Apex Trader Funding $300K challenge. The script accounts for the Daily Sentiment Index (DSI) at 87 (overbought, favoring pullbacks). It generates alerts for placing stop-limit orders for 175 MGC contracts, ensuring compliance with Apex’s rules ($7,500 trailing threshold, $20,000 profit target, 4:59 PM ET close).
Script Requirements
Version: Pine Script v6 (latest for TradingView, April 2025).
Purpose:
Bullish: Alert when price breaks above a rejection candle’s high after a two-legged pullback to the 20 EMA in a bullish trend (price above 20 EMA, VWAP, higher highs/lows).
Bearish: Alert when price breaks below a rejection candle’s low after a two-legged pullback to the 20 EMA in a bearish trend (price below 20 EMA, VWAP, lower highs/lows).
Context: 5-minute MGC chart, U.S. session (8:30 AM–12:00 PM ET), avoiding overbought breakouts above $3,450 (DSI 87).
Output: Alerts for stop-limit orders (e.g., “Buy: Stop=$3,377, Limit=$3,377.10” or “Sell: Stop=$3,447, Limit=$3,446.90”), quantity 175 MGC.
Apex Compliance: 175-contract limit, stop-losses, one-directional news trading, close by 4:59 PM ET.
How to Use the Script in TradingView
1. Add Script:
Open TradingView (tradingview.com).
Go to “Pine Editor” (bottom panel).
Copy the script from the content.
Click “Add to Chart” to apply to your MGC 5-minute chart .
2. Configure Chart:
Symbol: MGC (Micro Gold Futures, CME, via Tradovate/Apex data feed).
Timeframe: 5-minute (entries), 15-minute (trend confirmation, manually check).
Indicators: Script plots 20 EMA and VWAP; add RSI (14) and volume manually if needed .
3. Set Alerts:
Click the “Alert” icon (bell).
Add two alerts:
Bullish Breakout: Condition = “Bullish Breakout Alert for Gold Futures Pullback,” trigger = “Once Per Bar Close.”
Bearish Breakout: Condition = “Bearish Breakout Alert for Gold Futures Pullback,” trigger = “Once Per Bar Close.”
Customize messages (default provided) and set notifications (e.g., TradingView app, SMS).
Example: Bullish alert at $3,377 prompts “Stop=$3,377, Limit=$3,377.10, Quantity=175 MGC” .
4. Execute Orders:
Bullish:
Alert triggers (e.g., stop $3,377, limit $3,377.10).
In TradingView’s “Order Panel,” select “Stop-Limit,” set:
Stop Price: $3,377.
Limit Price: $3,377.10.
Quantity: 175 MGC.
Direction: Buy.
Confirm via Tradovate.
Add bracket order (OCO):
Stop-loss: Sell 175 at $3,376.20 (8 ticks, $1,400 risk).
Take-profit: Sell 87 at $3,378 (1:1), 88 at $3,379 (2:1) .
Bearish:
Alert triggers (e.g., stop $3,447, limit $3,446.90).
Select “Stop-Limit,” set:
Stop Price: $3,447.
Limit Price: $3,446.90.
Quantity: 175 MGC.
Direction: Sell.
Confirm via Tradovate.
Add bracket order:
Stop-loss: Buy 175 at $3,447.80 (8 ticks, $1,400 risk).
Take-profit: Buy 87 at $3,446 (1:1), 88 at $3,445 (2:1) .
5. Monitor:
Green triangles (bullish) or red triangles (bearish) confirm signals.
Avoid bullish entries above $3,450 (DSI 87, overbought) or bearish entries below $3,296 (support) .
Close trades by 4:59 PM ET (set 4:50 PM alert) .

[Tradevietstock] Market Cycle Detector_Quantum Flux Best technical indicator to detect market cycles - Quantum Flux
Hello folks, it's Tradevietstock again! Today, I will introduce you to Quantum Flux Indicator, which can help you identify market cycle and find your best entry/exit effectively.
i. Overview
1. What is Market Cycle Detector_Quantum Flux?
The Quantum Flux Indicator is developed specifically to analyze and detect market cycles across a variety of asset classes. Whether you trade stocks, crypto, forex, or commodities, this indicator provides a consistent framework to track trends and time your positions.
2. Supported Markets:
Stock Market
Crypto Market
Commodities
Forex
You can apply the same cycle-based strategy across all these markets using QFI.
Depending on the platform you're using, here’s how you can start using Quantum Flux:
TradingView Users:
Once your invite is approved, the indicator will be added to your TradingView account. You can access it directly through the Indicators tab.
MT5 / Amibroker Users:
After your payment is completed, we will send you the QFI script. You can then import it manually into your MT5 or Amibroker trading platform.
ii. Setting Up the Indicator
1. Choose Your Setup
There are two ways to configure the Quantum Flux - The best indicator to detect market cycles
Default Setup (Recommended)
This includes both the Quantum Aroon and some of the Premium MACD signals. This full setup is ideal for traders who want a complete view of the market cycle with detailed signals. You just need to turn off the Premium MACD_Components as the image below
MACD-Only Setup
In this mode, the Quantum Aroon module is disabled. The indicator will rely solely on the Premium MACD Setting to generate signals. While this option is available, we recommend using the full setup for the most accurate performance.
2. Recognize the Market Cycle Phases
According to Tradevietstock’s theory , every trading asset typically moves through four distinct phases in a complete cycle:
Bearish Phase - Bear Market
First Bullish Wave - The Recovery
Strong Correction Phase
Final Bullish Wave
Quantum Flux generates visual and data-driven signals to help you time your trades accurately.
Green Dots: MACD crossover → Potential buy signal
Red Dots: MACD crossunder → Potential sell signal
Quantum Aroon Crossover: Confirms bullish trend or Buy Signals
Quantum Aroon Crossunder: Confirms bearish trend or Exit Signals
Green background: Extreme Bullish Phase
Red background: Extreme Bearish Phase
The Extreme Bullish/Bearish Phase is a unique feature of our system that enhances trading signals by capturing moments when the market moves aggressively—either in a strong uptrend or downtrend. This phase often represents the peak of Greed in bullish markets and Fear in bearish ones, offering a way to gauge market sentiment visually. The intensity of the background color helps interpret this: a bolder green indicates a more extreme bull market, while a deeper red signals an extreme bear market.
It's important to note that the Extreme Bullish/Bearish Phases are not direct entry or exit signals. Instead, they serve as enhancement signals that help traders make more informed decisions. These phases provide insight into whether it's wise to wait for additional confirmation before entering a trade, or to hold existing positions longer until clearer exit signals—like red dots or crosses—appear. By identifying the market's most intense emotional points, these signals help traders better align with momentum rather than react prematurely.
=> In summary, the Extreme Bullish/Bearish Phase provides valuable insight into market sentiment by highlighting emotional extremes, helping traders navigate aggressive trends with greater confidence. However, like all features in the indicator, its purpose is to complement, not replace, the core entry and exit signals—which are still based on crosses and dots. As always, green indicates bullish conditions, and red indicates bearish, but sentiment alone doesn't drive the trades—signals do.
3. The logic of the indicator and its trading strategy
Many traders are familiar with Wyckoff's theory, which, while foundational, can feel outdated and inefficient for real-life trading in today's fast-paced markets. It takes time to apply and may not be the most practical approach. That’s why many turn to day trading, but without the right tools and strategy, it can lead to account blow-ups.
The traditional market cycle consists of four stages: accumulation, markup, distribution, and markdown. While this is accurate, it's not always sufficient for modern trading. We need something more practical.
According to Tradevietstock's theory, the market cycle can be broken into four stages: a bear market, recovery, correction wave, and a bull market (the strongest uptrend). This new approach offers a shorter and more efficient timeline compared to Wyckoff's or other older cycle theories, making it a safer and more practical alternative to intraday trading.
To trade with market cycles, you need to remember these four stages:
Bearish Phase - Bear Market
First Bullish Wave - The Recovery
Strong Correction Phase
Final Bullish Wave
The logic for BUY/SELL (Entry/Exit) signals is built on a combination of crossover and crossunder events from the Quantum Aroon and Premium MACD indicators. Our Quantum Aroon is an enhanced version that applies a custom zero-lag smoothing function, making its trend signals more responsive and accurate than the traditional Aroon. It also includes a signal line for crossover alerts, along with visual enhancements like color-coded backgrounds, arrows, and gradient fills to highlight different market phases. Integrated with normalized MACD and RSI, it helps confirm signals and identify overbought or oversold conditions. Most importantly, it's aligned with Tradevietstock’s 4-phase market cycle—Bear Market, Recovery, Correction, and Bull Market—making it especially practical for real-world trading.
The Premium MACD differs from the standard version by introducing several key improvements. It normalizes the MACD line, signal line, and histogram for consistent interpretation across assets and timeframes, improving visual clarity. It also supports multi-timeframe analysis, allowing users to choose between the current chart resolution or a custom timeframe. The indicator includes color-coded histogram bars to show momentum changes and uses large dynamic circles to highlight crossover points.
=> These enhancements improve signal accuracy and make trend reversals easier to spot. Paired with the Quantum Aroon, it serves as a powerful confirmation tool within the Tradevietstock cycle framework.
4. Get to practice
In the example of NVDA, you can observe all four phases in action. For medium- to long-term traders, Phase 2 and Phase 4 usually present the strongest buying opportunities. Phase 1 and Phase 3 are accumulation phases — where prices are lower and preparations are made for the next bullish leg.
We can examine the following example to better understand Phase 1: The Bear Market . This phase only begins after a prior uptrend in the stock price . It’s crucial to remember that Phase 1 is not the start of the overall trend—it marks the reversal following a bullish run.
For instance, take the LMT stock: after a 50% rise, Quantum Flux displays a green background, indicating an 'Extreme Bullish Phase.' Once this bullish phase concludes, it sets the stage for a valid Phase 1—the beginning of the Bear Market.
The stock price declines sharply, triggering Quantum Flux to display a red background as the Aroon line crosses below the signal line.
Phase 1 concludes when we observe multiple crossover signals—most notably when the Aroon line crosses above the Signal line—and the red background, which signifies the Extreme Bearish Phase, disappears. Let's take a look at the image below:
Let’s move on to Phase 2: The Recovery. This phase follows the Bear Market—Phase 1. After a significant decline in the stock price, a recovery or pullback is expected.
Our signals for this phase include green dots and crosses, along with the confirmation signals that mark the end of Phase 1. This combination provides valid Buy signals and presents opportunities for mid-term investment strategies.
Phase 3 is a correction wave after the recovery . We also incorporate the cross and dot signals during this phase. In Phase 2, the strategy involves preparing to sell or take profits once the recovery phase matures. Whenever red dots or red crosses appear, they serve as indicators to consider taking profits, signaling the potential end of the upward move.
In Phase 3, known as the correction wave, the key objective is to take profits before the price begins to decline. This phase represents a temporary pullback following the recovery. Importantly, the end of Phase 3 often presents a strong buying opportunity—just before the onset of Phase 4, which is the strongest bullish wave. Whenever green dots and crosses appear at this stage, they serve as clear Buy signals, allowing us to position early for the upcoming bullish momentum.
Phase 4 is the strongest bullish wave—one that investors definitely don’t want to miss. Having entered at the end of Phase 3, the goal in Phase 4 is to maximize gains by targeting the highest highs.
During this phase, we closely monitor our exit signals, which include the appearance of red dots and red crosses, as well as the disappearance of the Extreme Bullish Phase indicator (green background). These signals help us lock in profits at the peak of the bullish momentum.
iii. Brief Conclusion on the Signals
End of Phase 1:
As Phase 1 nears completion, green dots start to appear. These serve as early entry signals, offering an opportunity to buy at lower prices before the trend reversal begins.
Phase 2 – Recovery:
Momentum begins to build during this phase. As it approaches its peak, red dots and Aroon line crossunders emerge—signaling that it's time to exit or reduce exposure in anticipation of a correction.
Phase 3 – Correction:
The indicator typically shows a red background, reflecting a bearish environment. This is a waiting phase—traders should remain cautious and avoid entering until green signals reappear.
Phase 4 – Strong Bullish Wave:
With the return of bullish signals (green dots, crosses, and green background), Phase 4 begins. After entering, the position is held to ride the strong momentum. Profit-taking signals include the appearance of red dots, red crosses, and the disappearance of the green background.
iv. Optimal Use by Market Type
Here’s how we suggest using QFI depending on what you trade:
Stocks: Best used on the Daily or Weekly chart for swing trades.
Cryptocurrency: Works well on BTC, ETH, or major altcoins using Daily and Weekly charts. Great for catching larger trend reversals.
CFDs and Forex: QFI is built for higher timeframes (H4, D1, W1), where it produces cleaner and more reliable signals.
Best Ways to Use It
🟢 Stocks
Works well on Weekly and Daily charts for swing entries
🟡 Crypto
Works best on Weekly and Daily charts
Good for trend-catching on BTC, ETH, or altcoins
🔴 CFDs
Designed with precision in mind — works on bigger timeframes, like H4, D1, and W1
The Quantum Flux Indicator is a flexible and powerful tool for anyone looking to navigate the full market cycle — from bottom to top and back again. With its ability to highlight key phases and generate timely signals, it becomes easier to plan your entries, hold through trends, and exit with confidence.
If you're serious about understanding market structure and improving your timing, Quantum Flux, the best Indicator to detect market cycles, can become a central part of your strategy — no matter what market you're in.

Uptrick: Stellar NexusOverview
Uptrick: Stellar Nexus is a multi-layered chart tool designed to help traders visualize market behavior with enhanced clarity and depth. It presents various overlays, signal triggers, and an asset-level behavioral table in one cohesive interface. Its core focus is to illustrate how different market states shift over time. By displaying directional structures, dynamic zones, momentum shifts, and a real-time probability assessment of multiple assets, it aims to deliver a comprehensive perspective for those looking to navigate complex market environments more confidently.
Purpose
The primary purpose of Stellar Nexus is to unify several market assessment methods into a single framework, sparing users the need to rely on multiple disjointed indicators. It is especially useful for traders who value having layered signals, interactive overlays, and a quick reference to asset-specific metrics within one tool. By consolidating multiple market insights, the script aspires to reduce guesswork, limit information overload, and present clear triggers for potential trade opportunities or risk management decisions.
Originality
Stellar Nexus stands out because it relies on a proprietary set of logic layers, each carefully designed to detect nuanced shifts in price movement. The script brings forward a streamlined depiction of underlying market changes through color-coded zones, shape markers, and short textual tags. Its architecture also accommodates multiple “modes” of viewing the market—be it through layered cloud structures, trend ribbons, or step-based overlays—so traders can adapt its outputs to match changing conditions. The presence of a specialized probability table and a real-time market state meter (HUD Meter) further underscores its uniqueness, providing at-a-glance scoring for various instruments and a gauge that visually displays ongoing transitions from trending to ranging phases.
Inputs
Stellar Nexus includes several user-configurable settings, organized into themed groups. Each input subtly modifies how information is derived or rendered on the chart:
General
Silken Veil (integer input) : Governs how smooth or responsive various underlying signals will appear.
Canvas (dropdown) : Chooses the primary visual overlay style among Nebula Trail, Velora, or Stellar Stepfilter.
Signals (dropdown) : Selects which built-in signal engine (Fluxor or Flowgen) is responsible for painting buy and sell markers.
Nova Tension (integer input) : Influences the internal motion sensitivity used by certain triggers.
Astral Ribbon (integer input) : Imparts a broader directional bias layer that can highlight whether the current environment is bullish or bearish.
Bands
Phase Delay (integer input) : Impacts baseline offsets for certain dynamic band calculations.
Band Softener (float input) : Creates a blended baseline, balancing two distinct smoothing techniques.
Spread Factor (float input) : Scales how wide or narrow the generated envelope bands become.
Layer Offset (float input) : Adjusts spacing between multiple layered boundaries in the band structure.
Smooth Mode (dropdown boolean) : Toggles an extra layer of smoothing on or off for the plotted envelopes.
Feed Matrix
Burst (integer input) : Adjusts how the Flowgen engine interprets momentum buildup. Higher values generally lead to more conservative signals.
Delta Curve Sync (integer input) : Alters the sensitivity of directional alignment within the Flowgen system, refining how quickly the script adapts to market slope changes.
Lambda Pulse Shift (integer input) : Controls timing offsets within the Flowgen structure, subtly influencing the trigger timing of transitions.
Sync Drift Limit (integer input) : Provides a stabilizing effect on the internal motion detection engine, helping reduce erratic behavior during choppy conditions.
WMA Open Filter Tunnel (integer input) : Filters signal validity by applying a dynamic range check on opening price structures, reducing false positives in unstable markets.
Probability Table
Show Predictability Table (boolean) : Enables or disables a table of asset metrics.
Show Numeric Values (boolean) : Switches between displaying numeric values and using simple directional markers in the table cells.
Stepfilter
Sensitivity (dropdown) : Offers a range of speed profiles (Very Fast to Very Slow and TURTLE option) that define how quickly or slowly the step-based overlay reacts to price changes.
HUD Meter
Show Stellar HUD Meter (boolean) : Turns on or off a specialized gauge for quick insight into trending vs. ranging conditions.
Take Profit Signals
Show TP Signals (boolean) : Determines whether exit or take-profit markers are displayed after certain conditions have been met.
Phase Length (integer input) : Influences the internal baseline used for the exit signal logic.
Sync Channel (integer input) : Sets a period within which different data points are compared or synced.
Filter (integer input) : Imposes an additional smoothing on exit-related cues.
Features
Signals (Fluxor and Flowgen)
Fluxor
Logic: Fluxor focuses on detecting specific price transitions, validating them against an internal directional and momentum layer, and then confirming the move based on the script’s overarching market bias.
Visual Representation: When Fluxor is activated, up and down label markers (“▲+” or “▼+”) appear at points the system regards as noteworthy transitions. These do not guarantee trades but are designed to guide users on when buying or selling pressure may have intensified or reversed.
How It Helps: Fluxor is streamlined for those who want simpler, clearer triggers that factor in both trend alignment and short-term motion shifts. This option is more for mean reversion traders.
Flowgen
Logic: Flowgen employs a slightly more sophisticated approach that evaluates multiple “environmental layers,” including structural alignment, directional slope checks, and distinct open-state filters.
Visual Representation: When Flowgen senses a valid transition, it prints discrete up and down markers, much like Fluxor, but triggered by different, multi-layer considerations.
How It Helps: Flowgen caters to traders who desire more emphasis on layered agreement—where multiple aspects of the market must line up before a signal is shown. This option is more for trend following traders.
Overlays (Nebula Trail, Velora, Stellar Stepfilter)
Nebula Trail
Purpose: This indicator employs dynamic, color-coded bands around price action to illustrate prevailing market bias and track which side—bulls or bears—wields greater influence, aligning with a trend-following approach.
Usage: This indicator creates outer and inner “band” regions that can function as potential support or resistance in alignment with market momentum. In bullish phases, the cloud below price acts as a supportive barrier, whereas during bearish conditions, the cloud above price provides a point of resistance. When a bearish signal is detected, traders may enter short positions on a price bounce off this band and then exit when subsequent take-profit cues appear, effectively leveraging the band for both entry and exit strategies.
Velora
Purpose: Extends the concept of band visualization into layered “tiers,” giving a more fine-grained view of how price transitions from one band to another.
Representation: Zones are subdivided into multiple steps, each with distinct shading. As the script’s internal logic detects shifts between bullish or bearish conditions, these layered bands expand or contract to reflect changing momentum.
Usage: Velora subdivides zones into multiple steps, each featuring distinct shading. As the script's internal logic detects shifts between bullish or bearish conditions, these layered bands expand or contract, signaling changes in momentum. When price enters the upper band, especially if the HUD meter shows less definitive momentum, it may hint at a non-trending environment; conversely, in a bearish scenario, the lower band can act as potential support. Narrower bands often point to an impending breakout, while wider bands can suggest a possible reversion in price. Velora is well-suited for traders wanting to see more intermediate zones where the market may hesitate or show partial confirmation—ideal for refined entries or exits.
Smooth:
Choppy:
Stellar Stepfilter
Purpose: Focuses on a persistent directional line that only updates when the script’s logic deems a genuine shift is taking place.
Representation: A single line plots on the chart to represent the “locked” direction. During periods of noise or indecision, this line may remain static, reducing false signals. Optionally, bars can be recolored to reflect bullish or bearish states.
Usage: Traders who prefer a minimalistic, stand-back approach often select Stellar Stepfilter for its ability to filter out choppy conditions and highlight clearer momentum strides. When the line remains flat—particularly in the very slow or “turtle” mode—it signals a ranging market, offering valuable insight into periods of reduced volatility. In TURTLE mode, bars are recolored green or orange to reflect locked trend direction more visibly. TURTLE mode offers the most conservative setting within the Stepfilter engine, emphasizing stability and clarity by reacting only to the strongest directional conditions and visually reinforcing its state through bar coloring.
Very Fast
Very Slow
TURTLE Mode
Probability Table
Description: The Probability Table is displayed on the top-right corner (by default). It automatically fetches data for a handful of assets (in this case, five popular cryptocurrencies), then scores each asset on multiple behavioral metrics. By default, the Probability Table monitors SOL, BTC, ETH, BNB, and XRP from Binance.
Metrics Explained:
HV: Suggests how the asset’s price is fluctuating relative to a standard reference.
ATR/Vol: A ratio that provides insight into volatility compared to trading activity.
WBR: Compares candle wicks against their bodies to gauge the frequency of price swings outside an open-close range.
Liq Clust: Indicates if there are pockets of stable or unstable liquidity.
Momentum: Observes shifts in buying or selling pressure.
PRI: Shows a baseline measure of how far price has deviated from a certain average over time.
Final Verdict: Based on each metric’s reading, an overall classification emerges: Predictable, Moderate, or Chaotic.
How It Helps: Traders can quickly scan this table to see if an asset’s environment is “Predictable” (potentially more structured), “Moderate” (balanced or transitional), or “Chaotic” (unstable and riskier). Each cell can optionally show either numeric approximations or simple “up/down” arrows to reduce clutter.
Non Numeric Values
Numeric Values
Stellar HUD Meter
Description: Located at the top center of the chart, this horizontal gauge toggles between “Trending” and “Ranging,” representing how firmly price is locked in directional expansion versus sideways hesitation.
Mechanics (General): The gauge increments or decrements over time, smoothing out abrupt shifts. A pointer slides across the meter, indicating whether conditions are leaning more toward persistent momentum or uncertain, choppy movement.
How It Helps: This immediate visual feedback helps traders decide if momentum strategies or mean-reversion approaches are more suitable at a given moment, avoiding reliance on guesswork alone.
Take Profit Signals
Description: After any buy or sell trigger occurs (either through Fluxor or Flowgen), the script can flag up to three potential exit points.
Trigger Logic (General): These exits appear when certain internal checks sense that short-term upside or downside pressure may be waning.
Representation: Small markers (“X”) appear near the top or bottom of the candle.
How It Helps: Rather than passively holding a position, these optional signals remind traders of possible exhaustion points. If they choose to follow them, it can help secure partial or full profits during a trend.
Why more than one indicator?
Having more than one internal indicator engine allows Stellar Nexus to adapt to different market behaviors and personal trading styles. Sometimes traders require swift, high-frequency triggers (Fluxor). Other times, they prefer more layered agreement before taking a position (Flowgen). Similarly, each overlay—Nebula Trail, Velora, and Stellar Stepfilter—offers a distinct method for visualizing price action. Markets are dynamic, and no single representation is ideal for all conditions. By blending multiple approaches into one script, Stellar Nexus provides flexibility: a user can switch between sets of signals or overlays based on market phase, personal risk preference, or the timeframe being traded.
Additional Features
Alert System: Built-in alerts for every trigger or state change ensure that traders can receive real-time notifications, even when away from the chart. The alert system includes buy/sell triggers, trend shifts, overlay transitions, take-profit points, and predictability status changes across monitored assets.
Selective Visibility: Users can enable or disable various modules—Probability Table, HUD Meter, Take Profit Signals—to keep their chart interface uncluttered.
State Persistence: Certain modules “lock in” their reading until a strong reason emerges to change it, which can help minimize false flips in volatile conditions.
Tailored Aesthetics: Color choices and label styling are curated to be visually distinct, reducing confusion when multiple signals or overlays occur simultaneously.
Conclusion
Uptrick: Stellar Nexus is a comprehensive, multi-layer script that merges aesthetic clarity with functional depth. It combines diverse overlays, signal engines, probability analyses, and a heads-up market meter into one cohesive tool. By handling trending vs. ranging states, evaluating asset predictability, and offering selective take-profit cues, it serves as a versatile companion for traders who want organized, visually intuitive guidance. Its originality is found not only in how it disguises internal computations, but in the ease with which users can cycle through different overlays and signals to suit changing market conditions. As always, personal due diligence, market awareness, and risk management remain essential. Stellar Nexus simply provides a refined canvas on which to read and interpret price action more confidently.
Disclaimer
This indicator is provided solely for informational and educational purposes. It does not constitute investment advice or a recommendation to engage in any trading activities. Trading and investing in financial markets involve significant risk, and past performance is not indicative of future results. Always conduct your own research, utilize proper risk management, and consider consulting a qualified financial professional before making any investment decisions. Neither the creator nor any contributors to this script accept any liability for financial losses or damages arising from its use. Users of this indicator assume full responsibility for their trading activities.

Dynamic Zone Risk Manager [Algo Seeker]Introduction
The Algo Seeker: Dynamic Zone Risk Manager excels in both ranging and trending market conditions. It merges two critical trading components: a zone identification system that allows traders to anticipate price movement within structured ranges and a dynamic risk assessment table that optimizes position sizing based on account parameters and zone-specific characteristics, while also calculating trade-specific risk and reward.
For traders struggling with consistent risk management and identifying high-probability zones, particularly in challenging ranging market conditions, this tool provides a structured framework that enhances precision in trading decisions and capital allocation — addressing two of the most common challenges in trading.
🟠 Unique Features & Trading Benefits
Advanced Zone Structuring:
🟢 The indicator adapts to different trading styles through Scalp, Swing, and Investor modes. Scalp mode generates tight, precise zones optimized for intraday price movements and quick trades completed within minutes or hours. Swing mode creates intermediate zones calibrated for positions held for the entire day or a few weeks, providing optimal zone structures for medium-term trading approaches. Investor mode establishes broader zones designed specifically for positions spanning a few weeks to a few months, identifying major support and resistance levels for extended holding periods.
🟢 These zones are particularly useful during ranging markets. They define clear price ranges within which movement may oscillate based on the selected trading horizon. Such clarity helps traders anticipate potential bounce areas and manage trades more effectively, even when the market lacks a clear directional trend.
🟢 The system transforms static price levels into comprehensive trading zones with clearly defined boundaries. The multi-dimensional architecture creates actionable entry, exit, and management levels that remain relevant across different market conditions.
Unique Risk Management:
🟢 A dynamic risk table that calculates position sizing based on the trader's actual account size. When traders select Scalp, Swing, or Investor mode, the table automatically computes the optimal capital allocation specifically for that mode and the current zone.
🟢 The table provides exact dollar amounts for both risk and potential reward based on current price position within the zone. If price is already moving through a zone, the table dynamically updates to show how much of the potential reward remains available.
🟢 This precise risk management system gives traders a clear, quantified understanding of exactly how much capital to allocate per trade, the specific dollar amount at risk, and the remaining profit potential—all updating in real-time as price moves through the zones.
Dynamic Cost Basis Analysis:
🟢 Continuously calculates optimal midpoints within each zone, creating additional precision pivot points that traditional tools can lack. These dynamic reference points enhance trade accuracy in ranging markets while providing essential data points for the integrated risk management calculations.
🟠 The Power of Integration: Zones Meet Risk Management
The true power of the Algo Seeker: Dynamic Zone Risk Manager emerges when these components work together as a unified system. The trader-selected strategy zones and dynamic risk table create a complete trading ecosystem that addresses the three critical elements of successful trading:
1. Precision Entry Points: Zone boundaries provide clear entry thresholds optimized for your selected trading mode (Scalp, Swing, or Investor), eliminating guesswork around optimal trade initiation points.
2. Disciplined Risk Control: The risk table's exact dollar calculations remove emotional decision-making from position sizing and stop placement, creating a consistent risk approach regardless of market volatility.
3. Strategic Exit Management: As price moves through zones, both visual cues and quantified metrics guide intelligent profit-taking decisions, preventing the common mistake of exiting too early or holding too long.
This synchronized framework transforms theoretical analysis into practical execution, giving traders a complete toolset for managing the entire lifecycle of each trade with precision and confidence.
🟠 Additional Algo Benefits
Psychological Trading Edge:
The Algo Seeker: Dynamic Zone Risk Manager addresses the most challenging aspect of trading—emotional decision-making. By transforming complex risk/reward calculations into clear, quantified metrics, the system eliminates decision paralysis and reactionary trading. Traders gain immediate clarity during volatile conditions through the visual integration of precise zones and risk parameters. This psychological framework cultivates discipline and confidence when market noise typically triggers impulsive decisions, allowing for consistent execution even during challenging market environments.
Efficiency and Time Value:
The system delivers exceptional time efficiency by eliminating the need for manual risk calculations, zone identification, and position sizing. What typically requires multiple tools and extensive spreadsheet calculations is seamlessly integrated into a unified interface. Traders receive immediate, actionable insights without the cognitive burden of juggling separate indicators. This allows professionals to focus on strategic decisions rather than technical calculations.
Advanced User Customization:
Unlike one-size-fits-all indicators, the Algo Seeker: Dynamic Zone Risk Manager adapts to individual trading methodologies. The system accommodates personalized account parameters and allocates capital differently based on three distinct trading modes—scalping, swing trading, and investing. This flexibility allows professional traders to implement their unique strategy while maintaining precise risk control across different positions and time horizons. The customizable table positioning and color schemes further enhance workflow integration for diverse trading environments.
🟠 How to Use
Initial Setup
1. Lookback Parameter: The Lookback Period determines which candle data the Dynamic Zone Risk Manager uses to establish trading zones:
🟢Lookback = 1 (Default): Uses the most recent closed candle to calculate zones. This provides stable analysis based on completed price action and is recommended for most trading scenarios.
🟢Lookback = 0: Uses the current, still-forming candle. This offers more immediate responsiveness, but zones may change as the candle develops. For consistent zone analysis, Lookback = 1 typically offers a better foundation.
2. Configure Account Parameters: Input your total trading capital in the settings panel to customize risk calculations specific to your account size.
3. Select Trading Mode: Choose between Scalp, Swing, or Investor modes based on your preferred trade style:
🟢Scalp: For intraday movements (minutes to hours)
🟢Swing: For medium-term positions (days to weeks)
🟢 Investor: For longer-term positions (weeks to months)
4. Account Parameters Setup: The risk management component requires your account size to provide accurate position sizing calculations.
🟢Total Account Size: Enter your total trading capital in the "Total Account Size ($)" input. All risk calculations are based on this value.
🟢Trading Allocation Percentages: The system allows you to divide your capital across three trading modes.
1. Scalp Allocation (%): Percentage of capital reserved for short-term trades
2. Swing Allocation (%): Percentage of capital for medium-term positions
3. Invest Allocation (%): Percentage of capital for longer-term investments
These percentages can be customized to match your personal trading strategy and risk tolerance.
Margin Multiplier: Adjust the margin multiplier value based on your broker's requirements and your preferred leverage.
The system uses these parameters to calculate appropriate position sizes for each trading mode, ensuring your risk exposure remains aligned with your capital management plan.
5.Visual Customization: Adjust color schemes and table positions to optimize for your workspace layout and visual preferences.
🟠 Risk Table Explanation
The dynamic risk tables provide real-time position sizing and risk metrics as price moves through different zones:
1. Zone Column: Displays the current zone where price is located.
2. Zone Size: Shows the total price range of the current zone.
3. Trade Type: Indicates the trading style (Scalp, Swing, or Invest).
4. Shares: Displays the calculated position size (number of shares) based on your account parameters and the current zone.
5. Risk($): Shows the approximate dollar amount at risk if the trade moves against you within the zone.
6. Reward($): Displays the potential dollar return if price moves completely through the zone in your favor.
7. Left: Indicates how much potential movement remains within the current zone based on the latest price.
The table updates dynamically as price moves, giving you real-time risk/reward information. Each trading style is displayed separately, allowing you to compare potential position sizes across different trade modes while maintaining consistent risk management.
🟠 Strategic Execution
Strategy Usage Example
The Algo Seeker: Dynamic Zone Risk Manager provides a complete framework for precise trading decisions. Here's how you might leverage its power:
1. Zone-Based Trading: The indicator identifies key zones and levels that serve as powerful pivot points. These are not arbitrary levels but mathematically derived zones where price is likely to react. Use these zones directly for your trading decisions.
2. Precision Entries: For long positions, enter near the lower boundary of a zone with targets at the upper boundary. For shorts, enter near the upper boundary with targets at the lower boundary. These levels identify potential entry points based on the underlying market structure.
3. Risk Management: The zone, level, or cost basis below your entry (for longs) or above your entry (for shorts) can serve as logical places to set stop losses, helping you define your risk on each trade.
4. Position Sizing Precision: Use the exact share/contract quantities displayed in the risk table. This eliminates guesswork in position sizing and provides both risk and profit calculations that align perfectly with your capital management strategy.
5. Strategic Exits: Take profits at the target zone boundaries identified by the indicator. These levels represent mathematical points where price may encounter resistance or support, providing potential exit opportunities.
6. Advanced Strategy Options:
🟢Consider taking partial profits at cost basis (midpoint) levels
🟢Trade from zone to zone using the defined boundaries
🟢Scale in or out at specific zone transitions
🟢Set trailing stops at subsequent zone boundaries as price progresses
The strength of this indicator lies in its ability to provide all the critical decision points needed for a complete trade - from entry to exit, with precise position sizing - all derived from its sophisticated algorithmic analysis rather than subjective interpretation.
🟠 Alert Configuration
1. Zone Crossovers: Set alerts for when price transitions between key zones.
2. Cost Basis Interactions: Configure notifications for when price approaches optimal entry points.
The Algo Seeker Wizard Ultra Risk represents years of development and refinement in professional trading environments. Its integration of sophisticated zone identification with precise risk management creates a comprehensive framework that transforms theoretical market analysis into actionable trading decisions with quantified risk parameters.

Enhanced Fuzzy SMA Analyzer (Multi-Output Proxy) [FibonacciFlux]EFzSMA: Decode Trend Quality, Conviction & Risk Beyond Simple Averages
Stop Relying on Lagging Averages Alone. Gain a Multi-Dimensional Edge.
The Challenge: Simple Moving Averages (SMAs) tell you where the price was , but they fail to capture the true quality, conviction, and sustainability of a trend. Relying solely on price crossing an average often leads to chasing weak moves, getting caught in choppy markets, or missing critical signs of trend exhaustion. Advanced traders need a more sophisticated lens to navigate complex market dynamics.
The Solution: Enhanced Fuzzy SMA Analyzer (EFzSMA)
EFzSMA is engineered to address these limitations head-on. It moves beyond simple price-average comparisons by employing a sophisticated Fuzzy Inference System (FIS) that intelligently integrates multiple critical market factors:
Price deviation from the SMA ( adaptively normalized for market volatility)
Momentum (Rate of Change - ROC)
Market Sentiment/Overheat (Relative Strength Index - RSI)
Market Volatility Context (Average True Range - ATR, optional)
Volume Dynamics (Volume relative to its MA, optional)
Instead of just a line on a chart, EFzSMA delivers a multi-dimensional assessment designed to give you deeper insights and a quantifiable edge.
Why EFzSMA? Gain Deeper Market Insights
EFzSMA empowers you to make more informed decisions by providing insights that simple averages cannot:
Assess True Trend Quality, Not Just Location: Is the price above the SMA simply because of a temporary spike, or is it supported by strong momentum, confirming volume, and stable volatility? EFzSMA's core fuzzyTrendScore (-1 to +1) evaluates the health of the trend, helping you distinguish robust moves from noise.
Quantify Signal Conviction: How reliable is the current trend signal? The Conviction Proxy (0 to 1) measures the internal consistency among the different market factors analyzed by the FIS. High conviction suggests factors are aligned, boosting confidence in the trend signal. Low conviction warns of conflicting signals, uncertainty, or potential consolidation – acting as a powerful filter against chasing weak moves.
// Simplified Concept: Conviction reflects agreement vs. conflict among fuzzy inputs
bullStrength = strength_SB + strength_WB
bearStrength = strength_SBe + strength_WBe
dominantStrength = max(bullStrength, bearStrength)
conflictingStrength = min(bullStrength, bearStrength) + strength_N
convictionProxy := (dominantStrength - conflictingStrength) / (dominantStrength + conflictingStrength + 1e-10)
// Modifiers (Volatility/Volume) applied...
Anticipate Potential Reversals: Trends don't last forever. The Reversal Risk Proxy (0 to 1) synthesizes multiple warning signs – like extreme RSI readings, surging volatility, or diverging volume – into a single, actionable metric. High reversal risk flags conditions often associated with trend exhaustion, providing early warnings to protect profits or consider counter-trend opportunities.
Adapt to Changing Market Regimes: Markets shift between high and low volatility. EFzSMA's unique Adaptive Deviation Normalization adjusts how it perceives price deviations based on recent market behavior (percentile rank). This ensures more consistent analysis whether the market is quiet or chaotic.
// Core Idea: Normalize deviation by recent volatility (percentile)
diff_abs_percentile = ta.percentile_linear_interpolation(abs(raw_diff), normLookback, percRank) + 1e-10
normalized_diff := raw_diff / diff_abs_percentile
// Fuzzy sets for 'normalized_diff' are thus adaptive to volatility
Integrate Complexity, Output Clarity: EFzSMA distills complex, multi-factor analysis into clear, interpretable outputs, helping you cut through market noise and focus on what truly matters for your decision-making process.
Interpreting the Multi-Dimensional Output
The true power of EFzSMA lies in analyzing its outputs together:
A high Trend Score (+0.8) is significant, but its reliability is amplified by high Conviction (0.9) and low Reversal Risk (0.2) . This indicates a strong, well-supported trend.
Conversely, the same high Trend Score (+0.8) coupled with low Conviction (0.3) and high Reversal Risk (0.7) signals caution – the trend might look strong superficially, but internal factors suggest weakness or impending exhaustion.
Use these combined insights to:
Filter Entry Signals: Require minimum Trend Score and Conviction levels.
Manage Risk: Consider reducing exposure or tightening stops when Reversal Risk climbs significantly, especially if Conviction drops.
Time Exits: Use rising Reversal Risk and falling Conviction as potential signals to take profits.
Identify Regime Shifts: Monitor how the relationship between the outputs changes over time.
Core Technology (Briefly)
EFzSMA leverages a Mamdani-style Fuzzy Inference System. Crisp inputs (normalized deviation, ROC, RSI, ATR%, Vol Ratio) are mapped to linguistic fuzzy sets ("Low", "High", "Positive", etc.). A rules engine evaluates combinations (e.g., "IF Deviation is LargePositive AND Momentum is StrongPositive THEN Trend is StrongBullish"). Modifiers based on Volatility and Volume context adjust rule strengths. Finally, the system aggregates these and defuzzifies them into the Trend Score, Conviction Proxy, and Reversal Risk Proxy. The key is the system's ability to handle ambiguity and combine multiple, potentially conflicting factors in a nuanced way, much like human expert reasoning.
Customization
While designed with robust defaults, EFzSMA offers granular control:
Adjust SMA, ROC, RSI, ATR, Volume MA lengths.
Fine-tune Normalization parameters (lookback, percentile). Note: Fuzzy set definitions for deviation are tuned for the normalized range.
Configure Volatility and Volume thresholds for fuzzy sets. Tuning these is crucial for specific assets/timeframes.
Toggle visual elements (Proxies, BG Color, Risk Shapes, Volatility-based Transparency).
Recommended Use & Caveats
EFzSMA is a sophisticated analytical tool, not a standalone "buy/sell" signal generator.
Use it to complement your existing strategy and analysis.
Always validate signals with price action, market structure, and other confirming factors.
Thorough backtesting and forward testing are essential to understand its behavior and tune parameters for your specific instruments and timeframes.
Fuzzy logic parameters (membership functions, rules) are based on general heuristics and may require optimization for specific market niches.
Disclaimer
Trading involves substantial risk. EFzSMA is provided for informational and analytical purposes only and does not constitute financial advice. No guarantee of profit is made or implied. Past performance is not indicative of future results. Use rigorous risk management practices.

FVG Visual Trading ToolHow to Use the FVG Tool
1. Identify the FVG Zone
Bullish FVG: Look for green boxes that represent potential support zones. These are areas where price is likely to retrace before continuing upward.
Bearish FVG: Look for red boxes that represent potential resistance zones. These are areas where price is likely to retrace before continuing downward.
2. Set Up Your Trade
Entry: Place a limit order at the retracement zone (inside the FVG box). This ensures you enter the trade when the price retraces into the imbalance.
Stop-Loss (SL): Place your stop-loss just below the FVG box for bullish trades or just above the FVG box for bearish trades. The tool provides a suggested SL level.
Take-Profit (TP): Set your take-profit level at a 2:1 risk-reward ratio (or higher). The tool provides a suggested target level.
3. Let the Trade Run
Once your trade is set up, let it play out. Avoid micromanaging the trade unless market conditions change drastically.
Step-by-Step Example
Bullish FVG Trade
Identify the FVG:
A green box appears, indicating a bullish FVG.
The tool provides the target price (e.g., 0.6371) and the stop-loss level (e.g., 0.6339).
Set Up the Trade:
Place a limit buy order at the retracement zone (inside the green box).
Set your stop-loss just below the FVG box (e.g., 0.6339).
Set your take-profit at a 2:1 risk-reward ratio or the suggested target (e.g., 0.6371).
Monitor the Trade:
Wait for the price to retrace into the FVG zone and trigger your limit order.
Let the trade run until it hits the take-profit or stop-loss.
Bearish FVG Trade
Identify the FVG:
A red box appears, indicating a bearish FVG.
The tool provides the target price and the stop-loss level.
Set Up the Trade:
Place a limit sell order at the retracement zone (inside the red box).
Set your stop-loss just above the FVG box.
Set your take-profit at a 2:1 risk-reward ratio or the suggested target.
Monitor the Trade:
Wait for the price to retrace into the FVG zone and trigger your limit order.
Let the trade run until it hits the take-profit or stop-loss.
Key Features of the Tool in Action
Visual Clarity:
The green and red boxes clearly show the FVG zones, making it easy to identify potential trade setups.
Labels provide the target price and stop-loss level for quick decision-making.
Risk-Reward Management:
The tool encourages disciplined trading by providing predefined SL and TP levels.
A 2:1 risk-reward ratio ensures that profitable trades outweigh losses.
Hands-Off Execution:
By placing limit orders, you can let the trade execute automatically without needing to monitor the market constantly.
Best Practices
Trade in the Direction of the Trend:
Use higher timeframes (e.g., 4-hour or daily) to identify the overall trend.
Focus on bullish FVGs in an uptrend and bearish FVGs in a downtrend.
Combine with Confirmation Signals:
Look for additional confirmation, such as candlestick patterns (e.g., engulfing candles) or indicator signals (e.g., RSI, MACD).
Adjust Parameters for Volatility:
For highly volatile markets, consider increasing the stop-loss percentage to avoid being stopped out prematurely.
Avoid Overtrading:
Not every FVG is a good trading opportunity. Be selective and only trade setups that align with your strategy.
Backtest and Optimize:
Use historical data to test the tool and refine your approach before trading live.
Common Mistakes to Avoid
Entering Without Confirmation:
Wait for price to retrace into the FVG zone before entering a trade.
Avoid chasing trades that have already moved away from the zone.
Ignoring Risk Management:
Always use a stop-loss to protect your account.
Stick to a consistent risk-reward ratio.
Trading Against the Trend:
Avoid taking trades that go against the prevailing market trend unless there is strong evidence of a reversal.
Final Thoughts
The FVG Visual Trading Tool is a powerful aid for identifying high-probability trade setups. By following the steps outlined above, you can use the tool to trade with confidence and discipline. Remember, no tool guarantees success, so always combine it with sound trading principles and proper risk management

Renz-GPT IndicatorThe Renz-GPT Indicator is a powerful, all-in-one trading tool designed to simplify decision-making and improve trade accuracy using a combination of trend, momentum, and volume analysis.
🔍 How It Works
Trend Detection:
Uses two EMAs (Exponential Moving Averages) to identify the current market trend.
A higher timeframe EMA acts as a trend filter to align trades with the larger market trend.
Momentum Confirmation:
RSI (Relative Strength Index) confirms the momentum strength.
Only takes trades when the momentum aligns with the trend.
Volume Confirmation:
Uses On-Balance Volume (OBV) to verify if volume supports the trend direction.
Signal Calculation:
Combines trend, momentum, and volume signals to create a high-probability trade setup.
Filters out weak signals to avoid false trades.
Entry, Stop Loss & Take Profit:
Displays clear LONG and SHORT markers on the chart.
Automatically calculates and displays Stop Loss and Take Profit levels based on ATR (Average True Range).
Alerts:
Sends real-time alerts when a valid buy or sell signal occurs.
Alerts include entry price, stop loss, and take profit levels.

*Auto Backtest & Optimize EngineFull-featured Engine for Automatic Backtesting and parameter optimization. Allows you to test millions of different combinations of stop-loss and take profit parameters, including on any connected indicators.
⭕️ Key Futures
Quickly identify the optimal parameters for your strategy.
Automatically generate and test thousands of parameter combinations.
A simple Genetic Algorithm for result selection.
Saves time on manual testing of multiple parameters.
Detailed analysis, sorting, filtering and statistics of results.
Detailed control panel with many tooltips.
Display of key metrics: Profit, Win Rate, etc..
Comprehensive Strategy Score calculation.
In-depth analysis of the performance of different types of stop-losses.
Possibility to use to calculate the best Stop-Take parameters for your position.
Ability to test your own functions and signals.
Customizable visualization of results.
Flexible Stop-Loss Settings:
• Auto ━ Allows you to test all types of Stop Losses at once(listed below).
• S.VOLATY ━ Static stop based on volatility (Fixed, ATR, STDEV).
• Trailing ━ Classic trailing stop following the price.
• Fast Trail ━ Accelerated trailing stop that reacts faster to price movements.
• Volatility ━ Dynamic stop based on volatility indicators.
• Chandelier ━ Stop based on price extremes.
• Activator ━ Dynamic stop based on SAR.
• MA ━ Stop based on moving averages (9 different types).
• SAR ━ Parabolic SAR (Stop and Reverse).
Advanced Take-Profit Options:
• R:R: Risk/Reward ━ sets TP based on SL size.
• T.VOLATY ━ Calculation based on volatility indicators (Fixed, ATR, STDEV).
Testing Modes:
• Stops ━ Cyclical stop-loss testing
• Pivot Point Example ━ Example of using pivot points
• External Example ━ Built-in example how test functions with different parameters
• External Signal ━ Using external signals
⭕️ Usage
━ First Steps:
When opening, select any point on the chart. It will not affect anything until you turn on Manual Start mode (more on this below).
The chart will immediately show the best results of the default Auto mode. You can switch Part's to try to find even better results in the table.
Now you can display any result from the table on the chart by entering its ID in the settings.
Repeat steps 3-4 until you determine which type of Stop Loss you like best. Then set it in the settings instead of Auto mode.
* Example: I flipped through 14 parts before I liked the first result and entered its ID so I could visually evaluate it on the chart.
Then select the stop loss type, choose it in place of Auto mode and repeat steps 3-4 or immediately follow the recommendations of the algorithm.
Now the Genetic Algorithm at the bottom right will prompt you to enter the Parameters you need to search for and select even better results.
Parameters must be entered All at once before they are updated. Enter recommendations strictly in fields with the same names.
Repeat steps 5-6 until there are approximately 10 Part's left or as you like. And after that, easily pour through the remaining Parts and select the best parameters.
━ Example of the finished result.
━ Example of use with Takes
You can also test at the same time along with Take Profit. In this example, I simply enabled Risk/Reward mode and immediately specified in the TP field Maximum RR, Minimum RR and Step. So in this example I can test (3-1) / 0.1 = 20 Takes of different sizes. There are additional tips in the settings.
━
* Soon you will start to understand how the system works and things will become much easier.
* If something doesn't work, just reset the engine settings and start over again.
* Use the tips I have left in the settings and on the Panel.
━ Details:
Sort ━ Sorting results by Score, Profit, Trades, etc..
Filter ━ Filtring results by Score, Profit, Trades, etc..
Trade Type ━ Ability to disable Long\Short but only from statistics.
BackWin ━ Backtest Window Number of Candle the script can test.
Manual Start ━ Enabling it will allow you to call a Stop from a selected point. which you selected when you started the engine.
* If you have a real open position then this mode can help to save good Stop\Take for it.
1 - 9 Сheckboxs ━ Allow you to disable any stop from Auto mode.
Ex Source - Allow you to test Stops/Takes from connected indicators.
Connection guide:
//@version=6
indicator("My script")
rsi = ta.rsi(close, 14)
buy = not na(rsi) and ta.crossover (rsi, 40) // OS = 40
sell = not na(rsi) and ta.crossunder(rsi, 60) // OB = 60
Signal = buy ? +1 : sell ? -1 : 0
plot(Signal, "🔌Connector🔌", display = display.none)
* Format the signal for your indicator in a similar style and then select it in Ex Source.
⭕️ How it Works
Hypothesis of Uniform Distribution of Rare Elements After Mixing.
'This hypothesis states that if an array of N elements contains K valid elements, then after mixing, these valid elements will be approximately uniformly distributed.'
'This means that in a random sample of k elements, the proportion of valid elements should closely match their proportion in the original array, with some random variation.'
'According to the central limit theorem, repeated sampling will result in an average count of valid elements following a normal distribution.'
'This supports the assumption that the valid elements are evenly spread across the array.'
'To test this hypothesis, we can conduct an experiment:'
'Create an array of 1,000,000 elements.'
'Select 1,000 random elements (1%) for validation.'
'Shuffle the array and divide it into groups of 1,000 elements.'
'If the hypothesis holds, each group should contain, on average, 1~ valid element, with minor variations.'
* I'd like to attach more details to My hypothesis but it won't be very relevant here. Since this is a whole separate topic, I will leave the minimum part for understanding the engine.
Practical Application
To apply this hypothesis, I needed a way to generate and thoroughly mix numerous possible combinations. Within Pine, generating over 100,000 combinations presents significant challenges, and storing millions of combinations requires excessive resources.
I developed an efficient mechanism that generates combinations in random order to address these limitations. While conventional methods often produce duplicates or require generating a complete list first, my approach guarantees that the first 10% of possible combinations are both unique and well-distributed. Based on my hypothesis, this sampling is sufficient to determine optimal testing parameters.
Most generators and randomizers fail to accommodate both my hypothesis and Pine's constraints. My solution utilizes a simple Linear Congruential Generator (LCG) for pseudo-randomization, enhanced with prime numbers to increase entropy during generation. I pre-generate the entire parameter range and then apply systematic mixing. This approach, combined with a hybrid combinatorial array-filling technique with linear distribution, delivers excellent generation quality.
My engine can efficiently generate and verify 300 unique combinations per batch. Based on the above, to determine optimal values, only 10-20 Parts need to be manually scrolled through to find the appropriate value or range, eliminating the need for exhaustive testing of millions of parameter combinations.
For the Score statistic I applied all the same, generated a range of Weights, distributed them randomly for each type of statistic to avoid manual distribution.
Score ━ based on Trade, Profit, WinRate, Profit Factor, Drawdown, Sharpe & Sortino & Omega & Calmar Ratio.
⭕️ Notes
For attentive users, a little tricks :)
To save time, switch parts every 3 seconds without waiting for it to load. After 10-20 parts, stop and wait for loading. If the pause is correct, you can switch between the rest of the parts without loading, as they will be cached. This used to work without having to wait for a pause, but now it does slower. This will save a lot of time if you are going to do a deeper backtest.
Sometimes you'll get the error “The scripts take too long to execute.”
For a quick fix you just need to switch the TF or Ticker back and forth and most likely everything will load.
The error appears because of problems on the side of the site because the engine is very heavy. It can also appear if you set too long a period for testing in BackWin or use a heavy indicator for testing.
Manual Start - Allow you to Start you Result from any point. Which in turn can help you choose a good stop-stick for your real position.
* It took me half a year from idea to current realization. This seems to be one of the few ways to build something automatic in backtest format and in this particular Pine environment. There are already better projects in other languages, and they are created much easier and faster because there are no limitations except for personal PC. If you see solutions to improve this system I would be glad if you share the code. At the moment I am tired and will continue him not soon.
Also You can use my previosly big Backtest project with more manual settings(updated soon)

Dynamic Timeframe Trend AnalyzerPurpose and Core Logic
This indicator automatically adjusts its calculations based on the current chart’s timeframe, allowing traders to analyze trends, momentum, and mean reversion opportunities without manually changing indicator settings for each interval. It detects potential long or short setups by combining several techniques:
Dynamic Timeframe Factor
The script compares the current timeframe to a base (e.g., 5 minutes) and calculates a “factor” to scale certain parameters, such as EMA lengths or ATR settings. This reduces the need to reconfigure indicators when switching timeframes.
Regime Detection
It uses ADX (Average Directional Index) to classify the market as strongly trending, moderately trending, choppy, or in a potential mean-reversion phase.
RSI (Relative Strength Index) is also monitored for extreme levels (e.g., overbought/oversold) to detect potential reversal zones.
Volume is compared to a moving average to confirm or refute volatility conditions.
Trend & Mean Reversion Signals
EMA Alignment (8/21/55) helps identify bullish or bearish phases (strong bull if all EMAs align upward, strong bear if aligned downward).
For mean reversion opportunities, the script checks if ADX is sufficiently low (indicating weak or no trend) while price and RSI are at extreme levels—suggesting a snapback or countertrend move may occur.
Dynamic Stop Loss & Take Profit
Uses ATR (Average True Range) to set initial stop-loss (SL) and take-profit (TP) levels, then adjusts these levels further with “regime multipliers” based on whether the market is in a high-volatility trend or a quieter mean-reversion environment.
This approach aims to place stops and targets in a more adaptive way, reflecting current market conditions rather than a one-size-fits-all approach.
Visual Aids
Color-coded chart backgrounds (e.g., greenish for bullish trend, red for bearish, yellow/orange for mean reversion).
Triangles to show recent bullish/bearish signals.
A status table in the top-right corner (optional) displaying key metrics like ADX, RSI, dynamic thresholds, current SL/TP levels, and whether a stop loss has been hit.
How It Works Internally
ADX & Dynamic Thresholds:
A moving average (adx_mean) and standard deviation (adx_std) of the ADX are calculated over a lookback period to define “strong” vs. “weak” ADX thresholds.
This allows the script to adapt to changing volatility and trend strength in different markets or timeframes.
Mean Reversion Criteria:
The indicator checks if price deviates significantly from its own moving average, alongside RSI extremes. If ADX suggests no strong directional push (i.e., the market is “quiet”), it may classify conditions as mean-reverting.
Regime Multipliers:
Once the script identifies the market regime (e.g., strong uptrend, choppy, mean reversion), it applies different multipliers to the user-defined base values for stop-loss and take-profit. For instance, strong trending conditions might allow for wider stops to handle volatility, while mean reversion signals use tighter exits to capture quick reversals.
How to Use It
Timeframe Agnostic
Simply apply it to any timeframe (from 1-minute up to daily or weekly). The “Dynamic Timeframe Factor” will scale the indicator parameters automatically.
Look for Buy/Sell Triangles
When the script detects a valid bullish trend shift or a mean-reversion long setup, it plots a green triangle under the price bar. Conversely, it plots a red triangle above the price bar for bearish or mean-reversion short setups.
Check the Status Table
The table in the top-right corner summarizes the indicator’s current readings: ADX, RSI, volume trends, and the market regime classification.
The table also shows if a stop loss has been hit (SL Hit) and displays recommended SL/TP levels if a signal is active.
Stop Loss & Take Profit
The script plots lines for SL and TP on your chart after a new signal. These lines are automatically adjusted based on ATR, volume conditions, and ADX-derived multipliers.
Mean Reversion vs. Trend-Following
If you see a “Mean Rev” state in the table or the background turning yellow/orange, it suggests potential countertrend trades. Conversely, “STRONG BULL” or “STRONG BEAR” states favor momentum-based entries in the prevailing direction.
Originality & Benefits
Adaptive to Timeframe: Many indicators require reconfiguration when switching from short to long timeframes. This script automates that process using the “timeframe factor” logic.
Regime-Based SL/TP: Instead of fixed risk parameters, the script dynamically tunes stop and target levels depending on whether the market is trending or reverting.
Comprehensive Market View: It combines multiple factors—ADX, RSI, volume, moving averages, and volatility measurements—into a single, integrated framework that categorizes the market regime in real time.
Best Practices & Notes
Timeframes: It typically performs well on intraday timeframes (5m, 15m, 1H) but can also be used for swing trading on 4H or Daily charts.
Settings: The defaults are a good starting point, but you can adjust the base ATR multiplier or ADX lookbacks if you prefer a different balance between sensitivity and stability.
Risk Management: This indicator is not a guarantee of any specific results. Always use proper risk management (position sizing, stop-losses, and diversified strategies).
Alert Conditions: Built-in alert conditions can notify you when a new long or short signal appears, or when a stop loss is triggered.
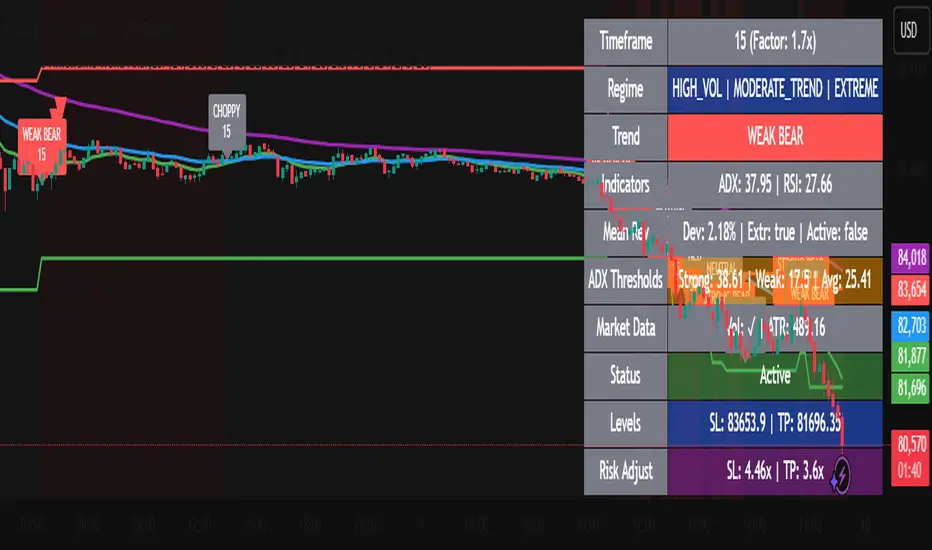
SMA Crossover with RSI ConfirmationThis is a sniper entry indicator that provides Buy and Sell signals using other Indicators to give the best possible Entries
Moving Average Crossovers:
The indicator uses two moving averages: a short-term SMA (Simple Moving Average) and a long-term SMA.
When the short-term SMA crosses above the long-term SMA, it generates a buy signal (indicating potential upward momentum).
When the short-term SMA crosses below the long-term SMA, it generates a sell signal (indicating potential downward momentum).
RSI Confirmation:
The indicator incorporates RSI (Relative Strength Index) to confirm the buy and sell signals generated by the moving average crossovers.
RSI is used to gauge the overbought and oversold conditions of the market.
A buy signal is confirmed if RSI is below a specified overbought level, indicating potential buying opportunity.
A sell signal is confirmed if RSI is above a specified oversold level, indicating potential selling opportunity.
Dynamic Take Profit and Stop Loss:
The indicator calculates dynamic take profit and stop loss levels based on the Average True Range (ATR).
ATR is used to gauge market volatility, and the take profit and stop loss levels are adjusted accordingly.
This feature helps traders to manage their risk effectively by setting appropriate profit targets and stop loss levels.
Combining the information provided by these, the indicator will provide an entry point with a provided take profit and stop loss. The indicator can be applied to different asset classes. Risk management must be applied when using this indicator as it is not 100% guaranteed to be profitable.
